Reporting on Opinion Polls in the Mass Media. Statement by the 2025-2027 Committee of the European Survey Research Association (ESRA)
897410.18148/srm/2026.v20i2.8974Reporting on Opinion Polls in the Mass Media. Statement by the 2025-2027 Committee of the European Survey Research Association (ESRA)
ESRA Committee, The Committee of the European Research Association, 2025-2027
University of Southampton Southampton UK
24762026European Survey Research Association
The European Survey Research Association (ESRA) has issued a statement expressing concerns over the declining methodological quality of opinion polls and the implications this has on public discourse and democratic processes. Recent technological advances have facilitated the proliferation of nonprobability online surveys, leading to increased media coverage of opinion polls without adequate scrutiny of their methodological rigor. ESRA highlights the improper use of terms like “representative” in defending poor-quality polls, which often distort the reality of public opinion. This statement is primarily directed at journalists, who play a crucial role in shaping public opinion by reporting survey results. ESRA offers practical recommendations for assessing the quality of opinion polls, emphasizing the importance of probability-based sampling, transparency in data collection modes, motivation behind polls, and meticulous questionnaire design. The statement also warns against non-probability sampling methods, which are susceptible to manipulations by automated bots and are not suitable for validly describing the public opinion of general populations. Furthermore, the ESRA urges careful consideration of margins of error and the “File Drawer” problem, where extreme or surprising results may overshadow more moderate but accurate findings. By promoting these standards, ESRA aims to support journalists and users of survey data in critically evaluating opinion polls and safeguarding democratic integrity.
Editors’ note
The statement was drafted and revised by Ulrich Kohler, Carina Cornesse, and Holger Lengfeld. Reviews and contributions were made by Michael Bergman, Pablo Cabrera Alvarez, Alessandra Gaia, Olga Maslovskaya, Angelo Moretti, Daniel Seddig and Tom W. Smith.
1 Preface
Over the past decades, technological advances have made it technically easier to conduct surveys. Online surveys in particular can often be carried out quickly, at lower cost, and with relatively little effort. As a result, media coverage of the findings of online surveys has increased considerably in recent years. This is especially true for so-called opinion polls, i.e. surveys that aim to identify “what the public thinks” about issues such as climate change, migration, or similar topics. ESRA is concerned that widely recognised quality standards in this area may be eroding. While critical engagement by journalists with the original sources of survey results is strongly encouraged, it does not offer sufficient protection against misleading messages.
Media outlets are increasingly reporting on opinion polls that are conducted without adequate methodological expertise or are launched with the intention of shaping public opinion. Commercial clients and producers of opinion polls frequently defend their work by claiming that their surveys are “representative”. ESRA stresses that the term “representative” is by no means a sufficient indicator of quality in opinion polling and is often used inappropriately. There is concern that the mass publication of methodologically inadequate opinion polls constructs a distorted image of reality, where fringe opinions appear more influential than they actually are. This problem is further exacerbated by so-called survey bots, which use Artificial Intelligence to simulate and articulate human opinions. As survey results play a role in shaping public opinion and influencing political decision-makers, this trend may have consequences that pose a threat to democratic processes.
With this statement, ESRA seeks to support users of opinion poll data in evaluating the polls’ methodological quality. The statement is primarily addressed to journalists, who play a central role as multipliers in the public opinion formation process. For this reason, we offer practical recommendations for journalists on reporting on opinion polls.
The following recommendations refer specifically to opinion polls. The recommendations do not generally apply to high-quality social surveys involving rigorous sampling and possibly experimental methods.
2 Criteria and Key Takeaways
2.1 Content Relevance of Opinion Polls
Before assessing the quality of opinion polls, it is essential to evaluate the content relevance of their results. ESRA emphasises that the more politically or socially significant a poll is, the more rigorously its methodological quality must be assessed. This includes topics that can influence public debate and political, economic, and civil society decisions. Such results from opinion polls should generally be published only if they meet high-quality standards.
Key takeaways
The more relevant (especially politically) you judge a poll’s findings to be, the more care should be taken in applying the following recommendations.
The publication of results from a poorly conducted poll, justified solely by entertainment value, should be clearly identifiable as such. Under no circumstances should results from polls with questionable methodological quality be placed at the centre of political reporting or even be featured on front pages.
2.2 Selection of Respondents
A key quality criterion of opinion polls is the method used to select respondents. In principle, a distinction must be made between two approaches: those in which respondents are randomly selected by the data collection agency (probability-based samples), and those in which respondents are purposively selected into the sample, usually because they volunteer or are otherwise easily available at low cost (non-probability samples). The latter include:
quota samples,
social media samples recruited via advertising campaigns,
so-called “river sampling”, where, for example, questions that may be interesting to readers are embedded in online articles as clickbait, and
so-called access panels, in which the individuals included were recruited or selected for the study using non-probability sampling methods.
Probability-based survey samples yield less biased results than non-probability survey samples. This remains true even when response rates in probability-based survey samples are low. As response rates for probability-based sampling have declined in recent years, practical approaches increasingly involve integrating non-probability samples into probability-based samples. The quality of the resulting surveys may exceed that of purely non-probability-based surveys. However, whether or not this is successful depends on many details that go beyond this statement.
Assuming comparable conditions, the sample quality of an opinion poll based on probability-based sampling increases with the size of the sample and the number of individuals successfully interviewed. This does not apply to non-probability samples. In such samples, a large number of respondents does not improve the survey’s quality, and any type of response or participation rate calculations are irrelevant in this regard. The key issue is that non-probability samples systematically attract highly selective groups of people (e.g. professional survey-takers), who differ in important ways from other people in the general population (e.g. those that would not click on a social media advertisement for paid surveys). Surveying a large number of highly selective people is no better than surveying a small number and just magnifies biases—both fail to account for the perspectives of the rest of the population.
Due to the declining willingness of individuals to participate in surveys, results based on probability-based samples require adjustments to account for differences between people who accepted the survey invitation and those who did not. Some online survey companies claim that their non-probability samples are corrected using superior methods based on complex statistical modeling. This claim is incorrect. The same procedures can, in principle, be applied to both types of samples. The success of these procedures depends on the applied statistical model and the relevance of the variables used for modeling. In practice, however, these procedures work better with probability-based samples—as a result, the difference between the sample and the target population is smaller in the case of probability-based sampling.
Key takeaways:
Results from opinion polls based on non-probability samples should be assessed considering the limitations of these sampling methods and, therefore, viewed with the utmost skepticism. In contrast to probability-based surveys, these polls are particularly vulnerable to manipulation by trolls or automated bots posing as human respondents to influence the results (e.g., for political reasons).
Surveys targeting specific, hard-to-reach population groups of societal relevance (e.g., LGBTQ+ individuals, refugees, homeless people) can only be conducted using probability-based samples with considerable difficulty and at a high cost if it is possible at all. ESRA considers reporting based on non-probability samples justifiable in such exceptional cases, but results should be reported appropriately: it should be clearly stated that the results usually cannot be generalised to the entire target population. Similarly, in other research contexts such as experimental studies, the use of non-probability samples may be acceptable. This, however, does not apply to conventional opinion polling.
Before publishing the results of any survey, insist on transparency regarding the following fundamental details (see further reading section for extended lists):
Which individuals could have been included in the sample (i.e., the target population)?
What method was used to select respondents?
How many individuals were invited to participate?
How many were actually surveyed?
If a data collection agency does not provide answers to all four questions, the results should not be reported. If reported, weblinks to documentation and, ideally, datasets for re-analysis should be provided.
2.3 Data Collection Modes of Opinion Polls
Opinion polls can be conducted in various ways: through face-to-face interviews, by telephone, online, or using paper questionnaires sent through postal mail. Each method has its advantages and disadvantages—especially when it comes to reaching certain target groups. Younger people are difficult to reach by phone, whereas older individuals are often hard to survey online. Those who refuse home visits by interviewers or fail to return questionnaires to the survey agency are even harder to include in surveys.
Unlike telephone or paper surveys, online polls face a fundamental challenge: there is no central registry of email addresses for any general population that can be used to send an invitation to a web survey. This makes it difficult to select participants at random. The existing approaches rely on traditional offline recruitment, which is both time-consuming and expensive. As a result, many online surveys are based on non-probability samples.
Other survey methods also face common implementation challenges. Response rates to telephone surveys are extremely low (often under 10% of all calls lead to an interview), and the costs of in-person interviews conducted in respondents’ homes have increased significantly, rendering them virtually obsolete in contemporary opinion research. From a methodological perspective, postal surveys—which were long out of favour—now perform quite well in many countries, provided that rigorous and persistent follow-up routines are in place. Increasingly, many high-quality social surveys and some opinion polls combine multiple survey modes (e.g. face-to-face, telephone, web and postal). However, all efforts to counter the inherent weaknesses of each method are both costly and time-intensive.
Key takeaways:
So far, studies have shown that offline surveys (face-to-face, telephone, or postal) as well as mixed-mode designs (combining different offline and/or online methods) tend to achieve higher response rates and produce results closer to high-quality benchmark values than surveys conducted exclusively online. The more politically significant the survey results are, the more the reporting should rely on surveys not conducted solely online and based on genuine probability-based samples.
Where sensitive topics are investigated, the relative anonymity of online or postal surveys can cut through shame or social pressure and reveal opinions that would otherwise remain hidden.
Great caution is advised when interpreting survey results that aim to measure public opinion shortly after a major event. Short-notice online surveys relying on non-probability samples can usually not fulfil the methodological demands to do this successfully as commonly too little information on the respondents is available to adjust for potential misrepresentation adequately. Long-term probability-based infrastructures with extensive background information on their respondents may be better suited as they can calculate and correct potential biases more easily based on prior knowledge of their respondents using established statistical procedures.
2.4 Motivation Behind the Poll
Public backing, whether by a majority of the population or substantial subgroups, can be a powerful asset for politicians seeking to advance their agendas. Similarly, interest groups stand to benefit when public opinion appears to align with their objectives. This creates an incentive to commission surveys for political purposes. Such motivations coincide with a survey environment, in which numerous variables can be adjusted to influence results in a desired direction. It is therefore essential to consider who commissioned a survey, which agency conducted it, and whether any subcontractors were involved, to ensure no conflict of interest is present.
Key takeaways:
Findings from studies that neither disclose the commissioning body nor the data collection agency should not be published under any circumstances.
Findings that align with the interests of those involved in the survey process should be treated with great caution. In particular, the standards outlined in this document should not be compromised. If reporting seems necessary despite concerns, these doubts should be made explicit. In all cases, potential conflicts of interest must be clearly declared.
Surveys commissioned at regular intervals by media outlets, foundations, or academic institutions, using largely consistent questionnaires over time, tend to be less problematic in this regard. Provided there are no major shortcomings in other quality criteria, the results of such surveys can be published and prominently featured.
2.5 Questionnaire Design and Leading Questions
As mentioned above, opinion polls offer ample opportunities to steer respondents’ answers—or the published results—in a particular direction. This can be done deliberately by interest groups or unintentionally due to unprofessional survey practices. Some of the most common techniques include:
The survey was conducted a long time ago and results are not relevant any longer.
Results refer to a subset of the population without explanation.
The question is embedded in a context that influences responses. For instance, preceding questions in a questionnaire—or the journalistic framing of an online poll—can bias the answers. A question placed after a news article describing the devastating effects of an earthquake is more likely to elicit support for aid to the affected region, whereas the same question, when following a report about corruption in local aid organisations, may lead to more respondents opposing such support.
The question is leading or ambiguously worded. Phrases like “Many people believe that too many migrants are coming to {country name}. To what extent do you agree?” tend to generate higher agreement levels than more neutral formulations, regardless of respondents’ actual opinions.
Adding or omitting response options can also skew results. For example, in hypothetical election questions, support for a new political party is lower when it is grouped under “Other” rather than listed by name alongside other parties.
Key takeaways:
Survey results should only be published if the data collection period and the exact wording of the question are disclosed. Additionally, the full questionnaire should be documented and made fully accessible before any articles are published.
If the questionnaire consisted of only a single question embedded within online media, the context—i.e., the articles in which the question appeared—must be documented. If the data collection agency is unwilling or unable to provide this information, the results should not be reported.
The subset of respondents to whom the survey results refer must be justifiable. For instance, if results are reported solely for men with high educational attainment, there should be a well-founded explanation for limiting the analysis to this specific group.
2.6 Random Variation
All survey results deviate to some extent from the true values in the population. This can be due to factors such as random sampling, random nonresponse, and unavoidable measurement errors. These fluctuations can be addressed by reporting margins of error. Doing so is always useful, as the conclusions drawn from survey results may change when such margins are taken into account alongside proportions or averages. These margins are typically visualised as confidence intervals, shown as lines or bands around the average (see the example in Fig. 1).

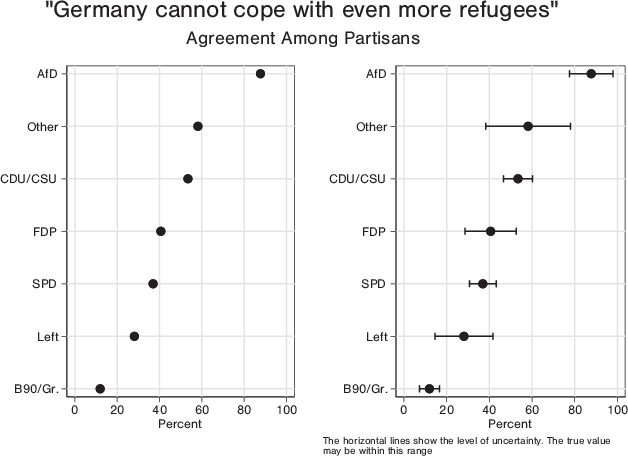
Fig. 1 Results from a German opinon poll with and without margins of error. The example shows results from the so-called Politbarometer of December 2022. Decide for yourself whether you would emphasize the differences between the Left and the SPD, or between the CDU and the FDP, if you only had the figure on the left. Would you write the same if you had the figure on the right?
Standard margins of error are impossible to calculate for non-probability samples since the standard statistical methods for error calculation rely on principles that only apply to probability-based sampling. One example is the law of large numbers, which we know from tossing fair coins: theoretically, there is a 50/50 chance of landing heads or tails. The more times we toss the coin, the more confidently we can demonstrate that by tossing a coin, we obtain heads 50% of the time. But if we are only allowed to toss the coin ten times, we would remain uncertain about whether the result will reflect the true 50/50 distribution. The same principle applies to probability samples: if enough individuals from a relevant group are randomly selected and surveyed, we can estimate the target group’s true opinion with increasing confidence. Non-probability samples, however, are not like coin tosses, so surveying more people doesn’t necessarily increase certainty about what we want to know; it may just magnify the bias. In such cases, margins of error cannot be directly calculated. Instead, they often need to be estimated under specific assumptions—for instance, by retrospectively applying statistical models that mimic random selection. Empirical evidence shows that the uncertainty in results from online surveys tends to be greater than the reported margins of error suggest.
Key takeaways:
Always require that the margins of error are reported alongside survey results. These margins can be clearly visualised in charts or graphs (see Fig. 1). Provide a brief explanation in the text on how to interpret them. Your audience will soon become familiar with this transparency and will appreciate the thoroughness of your reporting.
Avoid vague or global statements such as “the statistical error is approximately 3%.” As shown in Fig. 1, margins of error can vary considerably across different indicators due to their different frequency in the survey.
Keep in mind that the reported margins of error often underestimate the true level of uncertainty. When interpreting small differences between values, exercise caution or refrain from drawing any conclusions at all.
2.7 The “File Drawer” Problem
Estimates of averages and proportions from opinion polls may overestimate or underestimate the true values in the population. This applies to all surveys, even those meeting the highest quality standards. When such over- or under-estimations are pronounced, the results may appear “extreme”, “striking”, or “surprising”. These kinds of results usually have a high news value, creating strong incentives to report on the survey. However, a focus on reporting predominantly “striking” surveys likely leads to systematic coverage of flawed polls, while more moderate and accurate results remain “in the file drawer”. Moreover, declining quality standards contribute to an increasing share of flawed survey results in the media landscape.
Key takeaways:
Ask yourself if the content would still be newsworthy even if the results were not surprising, extreme, or otherwise attention-grabbing. Be especially cautious in the reporting of findings if the answer is “no”.
Surveys that are only considered newsworthy because of their unexpected results should be covered only if they meet the highest methodological standards.
If the findings are surprising, we recommend comparing them with other studies. If those studies yield different results, this discrepancy should be documented and critically examined. High-quality social surveys, especially those that offer measurements over a longer time series, are the best option to compare the results to.
3 Further Reading
Some readers of this statement may find it useful to continue their reading, especially in terms of statements by other organizations and widely applicable industry standards. We therefore offer a non-exhaustive list of related texts here: