
“Absence of evidence is not evidence of absence.” This quote, attributed to the astronomer and science communicator Carl Sagan neatly summarizes the nature of null findings (Feres & Feres, 2023): While null findings may indeed indicate the true absence of an expected effect, they may also arise because the treatment was ineffective.
This paper presents a case of a null finding driven by a partially ineffective manipulation in a survey experiment. The aim of the study was to examine the effects of working in gender-atypical occupations on one’s dating desirability. Our theoretical argument was built on the concept of occupational sex-typing, defined as the extent to which occupations are culturally associated with men or women. To test our hypothesis that such sex-typing affects individuals’ perceived dating desirability, we operationalized occupational sex-typing using official data on occupational gender segregation, i.e., whether an occupation was male- or female-dominated. However, a manipulation check revealed that respondents did not consistently identify the actual gender composition of the occupations used in our study, e.g., although it is predominantly women who work as librarians in Germany, most respondents did not perceive librarians to be a female-dominated occupation.
Rather than treating this case as a binary instance of experimental “failure,” we interpret it as evidence of how implementation challenges can threaten the identification of causal mechanisms in survey experiments and seek to derive general lessons from our null finding. To do so, we first discuss the necessity of precisely specifying the theoretical quantity of interest—the estimand (Auspurg & Brüderl, 2021; Kohler et al., 2024; Lundberg et al., 2021)—to conceptually distinguish between a failure of an experimental manipulation and a genuine null finding. Second, we analyze the level of misperceived gender-typicality in the occupations used in our study and the factors contributing to these misconceptions. Third, we highlight the trade-offs between internal and external validity that researchers face when designing their experiments. Fourth, we discuss several strategies to minimize identification threats in survey experiments and provide practical insights for researchers interested in studying the effects of gender-typical vs. gender-atypical occupations.
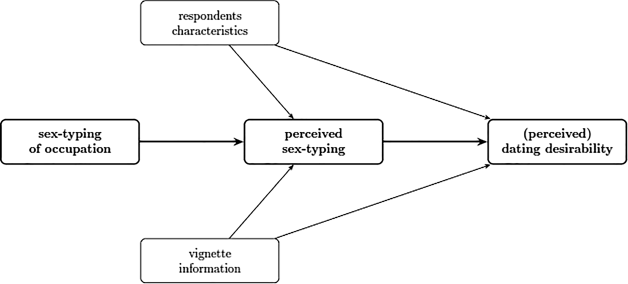
Our preregistered survey experiment was part of a multi-study project examining the effects of working in a gender-atypical occupation on men’s and women’s dating desirability (Hipp et al., 2024). The project’s central research question was: Do men and women in gender-atypical jobs have lower chances of finding a different-sex partner than those in gender-typical jobs? And, if so, are women and men aware of such occupational partnership penalties? As summarized in Fig. 1, our main hypothesis was that working in a gender-atypical occupation would negatively affect a person’s actual and perceived dating desirability. Hence, formally, our estimand is the causal effect of working in a gender atypical occupation on the (perceived) dating desirability of an opposite-sex person.
However, the effect of occupational sex-typing on (perceived) dating desirability requires further qualification: Occupational characteristics can only influence individuals’ (perceived) dating desirability if they are both noticed and considered relevant by potential partners (or people assessing someone else’s dating desirability)—a point that becomes important when interpreting our findings.
Fig. 2 therefore presents a more nuanced model. First, the effect of occupational sex-typing on dating desirability operates through people’s perceptions of whether an occupation is gender-typical or atypical. Second, perceptions of occupational sex-typing may also depend on individual-level characteristics (e.g., the respondent’s education) and additional information about the potential partner (e.g., financial situation or job position). Accordingly, the experiment can only identify an intent-to-treat effect of occupational gender-typing, because the underlying mechanism of interest is activated only when the occupational cue is indeed perceived as gender-typical or gender-atypical.
One component of our multi-study project was a factorial survey experiment (FSE) in which respondents evaluated the dating desirability of fictitious profiles varying in occupation, age, education, financial situation, and physical attractiveness. The FSE was intended to complement two previous studies: an observational study that found an occupational partnership gap but could not identify causal effects, and a field experiment on a dating app that revealed a causal penalty for gender-atypical occupations but was limited to two occupations and a narrow set of socio-demographic groups (Hipp et al., 2024). By employing an FSE, we aimed to estimate causal effects across a broader range of occupations and socio-demographic characteristics. In addition, with the FSE we wanted to address the second part of our research question—whether individuals are aware of and anticipate occupational partnership penalties—by examining whether people in gender-atypical occupations are perceived as less desirable dating partners.
Our theoretical framework was built on the concept of sex-typing—the classification of occupations as “male” or “female” based on norms, stereotypes, and associated tasks. For instance, nursing and early childhood education are typically considered female-typed, whereas engineering and construction are considered male-typed (Baird, 2012; Bajka et al., 2025; Block, 2023; Combet, 2024; Heilman et al., 2024; Hsiung, 2022; Puzio & Valshtein, 2022; Simpson, 2004). In practice, researchers often operationalize sex-typing by using the gender composition of occupations rather than their symbolic or normative classification (Bächmann, 2023; Hamjediers & Peters, 2024; Leuze & Strauß, 2014; Levanon et al., 2009; Tophoven et al., 2015). Following this approach, we used the proportion of women and men within occupations to approximate their gender-typicality in our FSE.
However, the selection of gender-segregated occupations for our study was challenging: We needed occupations that differed in gender composition but were comparable on other, dating-relevant characteristics, most notably status and pay (Buss, 1989; Fales et al., 2016). First, male-dominated occupations are more often classified as being high status than female-dominated occupations (Busch, 2017; England, 1992, 2011; Garcia-Mainar et al., 2018; Magnusson, 2009, 2013). Second, male-dominated jobs typically offer higher earnings or steeper wage growth than female-dominated jobs (Alksnis et al., 2008; Bartnik et al., 2022; England, 2010; Galos & Strauss, 2023; Leuze & Strauß, 2016). Third, available official statistics (at least in Germany, where we conducted the experiment) provide information on gender composition only at aggregated occupational levels, not for specific job titles.
To address these constraints, we selected 60 occupations across six groups of either low, medium, or high occupational status and with either more than 70% or less than 30% women (Anker, 1998; Bächmann, 2023; Cohen, 2004; Leuze & Strauß, 2014). To ensure the effectiveness of our experimental treatment, we sought to further strengthen status cues by including information on leadership roles and educational attainment and to increase the salience of gender-typing by adding contextual information on the industry and sector.
Our vignette universe consisted of 96 conditions per age group, resulting from a factorial combination of gender (2), financial situation (2), physical attractiveness (2), place of birth (2), occupational gender composition (2), and occupational status (3). Three example vignettes are shown in Fig. 3.
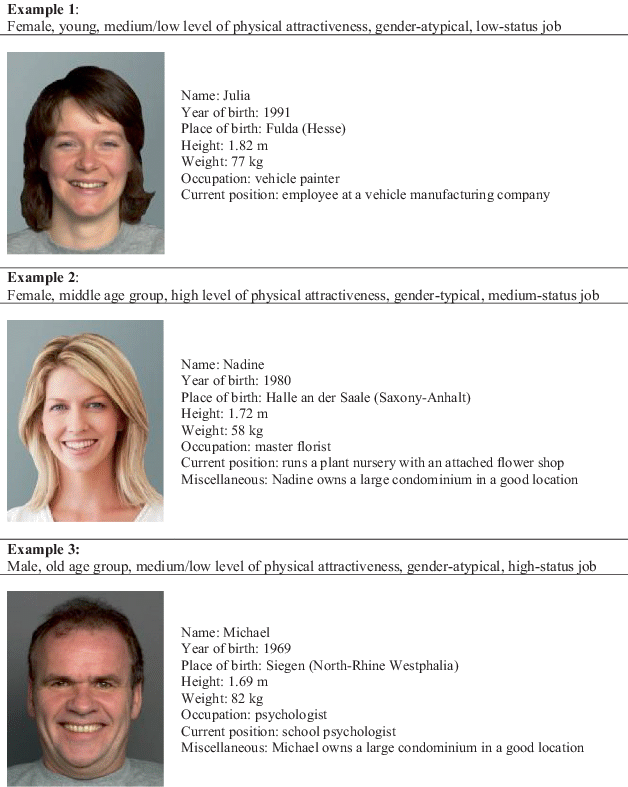
Fig. 3 Example vignettes for the three age groups used in the survey experiment. Photograph examples 1 and 3: FACES database, Max Planck Institute for Human Development, Center for Lifespan Psychology, Berlin, Germany (Ebner, Riediger, Lindenberger 2010), used with permission under the FACES Platform Release Agreement. Photograph example 2: iStock (licensed picture).
To enhance realism, we used multiple occupations per occupational gender-status group. This approach, however, potentially introduces variation in how respondents perceive the gender-typing of specific occupations within the same occupational gender-status group—an issue that becomes central for interpreting our results. Out of the 96 experimental conditions, we drew a D-efficient sample of 60 vignettes based on a resolution-IV design to ensure orthogonality of the main effects (but not of all two-way interactions—another issue we revisit below) and assigned them to 12 decks (Auspurg & Hinz, 2015).
We ran the experiment in 2019-2020 using a commercial survey company that worked with a nonprobability sample of people who voluntarily sign up for participation in various studies. Participants were recruited using quotas for gender, age, and education and were asked to rate five vignettes (plus an additional anchor vignette that was shown at the beginning of the study but not used in the analyses).
Within this survey, we implemented two attention checks to ensure that respondents actually engaged in the experimental task. In the first attention check, we asked respondents to identify the occupation of the person shown in the vignette from a set of five options. In the second attention check, conducted after respondents had evaluated all five vignettes, we asked them to recall the year of birth of the person in the last vignette, providing four answer choices. Since all individuals in the vignettes were born in the same year, any confusion between vignettes did not pose a problem. Respondents who failed either of these attention checks were screened out the survey. This affected a total of 113 respondents in the first and 88 respondents in the second check.
After evaluating the vignettes along a series of dimensions, respondents were asked about the likelihood that women/men looking for a serious/casual relationship would want to get to know the person displayed on the vignette (hence, a second-order preference) using an answer slider ranging from 0 to 100. They then completed a post-survey questionnaire on socio-demographic characteristics and gender attitudes. Finally, as a key manipulation check, respondents estimated the proportion of women or men in the occupation shown in the vignette (with the gender reference in the question randomized).
In contrast to our theoretically derived expectations, we did not observe a dating penalty for working in a gender-atypical occupation in our FSE. Fig. 4 displays OLS estimates of vignette persons’ dating desirability by occupational gender-typing (gender-atypical as the reference category), vignette gender, and respondent gender, with standard errors clustered at the respondent level. Occupational gender-typing is operationalized as a binary indicator equal to 1 if at least 70% of workers in the occupation belong to the respective gender, based on external statistics.
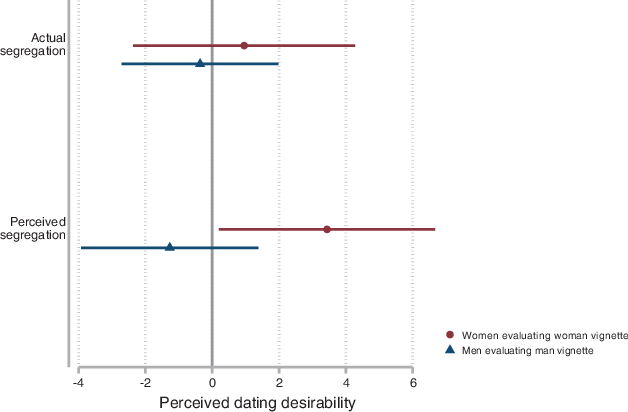
Fig. 4 Effect of actual vs. perceived occupational gender-typicality on perceived dating desirability by vignette and respondent gender.Coefficients show the effect of a vignette person working in a gender-typical occupation on perceived dating desirability (reference category: gender-atypical occupation), with 95% confidence intervals. The dependent variable is the perceived dating desirability of the vignette person (scale from 0 = “not at all desirable” to 100 = “very desirable”). “Actual segregation” is based on the occupation’s observed gender composition; “perceived segregation” is based on respondents’ classifications of the occupation as at least 70% women or men. Models are estimated separately by respondent and vignette gender, include controls for vignette characteristics (age, attractiveness, education, financial situation, and region of origin), and use respondent-clustered standard errors. Nwomen = 697, Nmen = 889 (vignette ratings).
The effect of working in a gender-typical occupation is close to zero with wide 95% confidence intervals. Accordingly, the FSE provides no evidence that respondents systematically evaluate dating desirability differently based on occupational gender-typing. This null result is notable given that other components of the project—including analyses of large-scale survey data, a field experiment conducted on a dating app, and a choice experiment embedded in a probability-based survey—identify patterns consistent with a dating penalty for gender-atypical occupations.
In the lower part of Fig. 4, we replicate the analyses using respondents’ perceptions of occupational gender composition (operationalized as a dummy variable equal to 1 if respondents estimate that at least 70% of workers in the occupation belong to the respective gender, and 0 otherwise). Although these estimates are still imprecise, the pattern of results aligns more closely with findings from the other studies in our project. Specifically, women tend to believe that other women working in occupations they perceive as gender-typical have better dating desirability than women in gender-atypical jobs. Men, by contrast, appear to expect that women prefer men who work in gender-atypical occupations.
The contrast between these two sets of results already hints at a potential explanation for the null finding: There seems to be a discrepancy between the actual and the perceived gender segregation, which raises the possibility that our experimental treatment did not successfully manipulate the construct we intended to study. And, indeed, a large proportion of respondents did not correctly perceive occupations as belonging to the intended gender-dominated category. Around 40% of ratings (1337 out of 3250 across 60 occupations) did not match the occupational gender classification based on a 70% threshold for male- or female-dominated occupations (and around 25% with a 60% threshold).
Figure 5 illustrates this discrepancy in a somewhat more nuanced way. The figure shows respondents’ estimates of the gender composition of the occupations used in the vignette experiment. Points represent the mean perceived share of men (left panels) or women (right panels) within each occupation, and horizontal lines indicate 95% confidence intervals around these estimates. Blue markers correspond to vignettes featuring a male person, while red markers correspond to vignettes featuring a female person. The vertical lines indicate the 70% threshold we used to classify occupations as male- or female-dominated based on the larger occupational group a specific occupation was part of.
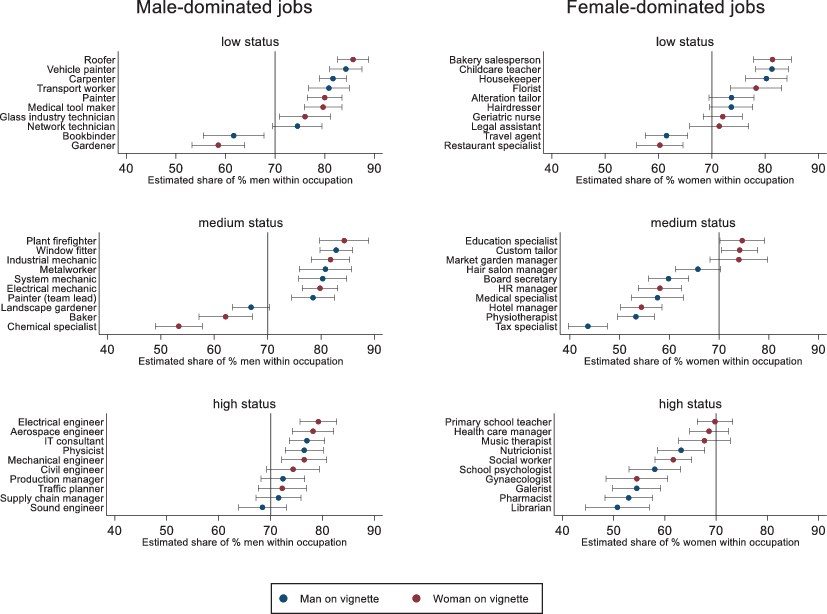
Fig. 5 Overview of the mean estimated gender compositions for male and female-dominated occupations by their actual gender composition.The figure shows study participants’ (N = 650) mean estimates of the gender composition of the occupations used in the vignette experiment. Points represent the mean perceived share of men (left panels) or women (right panels) within each occupation; horizontal lines show 95% confidence intervals. Blue markers correspond to vignettes featuring a male person, red markers to vignettes featuring a female person. The vertical lines indicate the 70% threshold used to classify occupations as male- or female-dominated. The gender composition for each of the 60 occupations listed in the figure was rated by at least 47 study participants.
Several patterns emerge from the figure. First, respondents generally recognize the broad gender composition of the occupations used in the experiment. Occupations classified as male-dominated are typically perceived as having more men and female-dominated occupations as having more women. However, the estimated shares of women and men in an occupation often deviate substantially from the 70% benchmark that is typically used to deem occupations as male- or female-dominated (Anker, 1998; Bächmann, 2023; Cohen, 2004; Leuze & Strauß, 2014). This suggests that respondents did not always perceive the extent of gender segregation in the way intended by the experimental manipulation.
Second, respondents’ estimates of gender composition appear to be less reliable for female-dominated occupations, especially those with medium or high occupational status. These occupations are perceived as substantially less gender-segregated than male-dominated occupations of comparable status or female-dominated occupations of lower status. In particular, several high-status female-dominated occupations—such as librarian, tax specialist, pharmacist, physiotherapist, hotel manager, gallerist, gynecologist, HR manager, school psychologist, and medical specialist—were, on average, perceived as having a substantially lower share of women than the 70% threshold that we derived from the larger occupational group we used to classify occupations. In contrast, the few male-dominated occupations that respondents failed to recognize as such—chemical specialist and gardener—tended to be of medium or low status. Thus, high-status occupations tend to be overly male sex-typed, while low-status occupations are mistakenly female sex-typed.
Third, the perceived gender composition of occupations varies to some extent depending on the gender of the vignette person displayed in the scenario. This pattern is directly related to a design feature of our experiment, which we discuss in more detail below.
Taken together, these patterns indicate that respondents did not consistently perceive occupations in line with the statistical gender composition used to define the experimental treatment. As a result, the manipulation of gender-typical versus gender-atypical occupations did not reliably generate the intended perceptual contrast, likely attenuating the estimated treatment effect.
There are several possible explanations for the observed misalignment between the intended experimental manipulation and respondents’ perceptions of occupational gender-typing. Some of these explanations are specific to the design and implementation of our survey experiment, while others relate to broader patterns in women’s and men’s labor market positions across and within occupations. In the following sections, we discuss these potential explanations in turn and, where possible, examine their empirical relevance.
A first and central explanation concerns the mismatch between occupational gender composition and perceived sex-typing. In our design, gender-typing is operationalized using the proportion of women and men within occupations. However, culturally shared perceptions of occupations as “masculine” or “feminine” are shaped by stereotypes, media representations, and historical gender compositions that may persist even when the actual workforce has changed (Jiang, 2025; Kay et al., 2015; Matheus & Quinn, 2017; Sebastián-Tirado et al., 2023; Thébaud & Charles, 2018). As a result, perceived gender-typing may diverge systematically from current gender distributions, weakening the link between the intended treatment and respondents’ interpretations.
A second explanation relates to the gendered connotations of occupational status. Higher-status occupations are often cognitively associated with masculinity, whereas lower-status occupations are associated with femininity (Froehlich et al., 2020; Kricheli-Katz, 2019; Oswald, 2003; Sebastián-Tirado et al., 2023). This may lead respondents to underestimate the share of women in high-status occupations, even when these occupations are actually dominated by women. While our data do not allow us to identify this mechanism causally, the observed misclassification of medium- and high-status female-dominated occupations is consistent with this interpretation (see Fig. 5).
A third explanation concerns structural labor market conditions and measurement limitations in operationalizing occupational gender composition. Female-dominated occupations tend to have lower average status, and women remain underrepresented in higher-status positions (Bosworth & Della Giusta, 2024; Busch, 2017; England, 1992, 2011; Garcia-Mainar et al., 2018; Magnusson, 2009, 2013; Ridgway et al., 2025; Taflaga & Kerby, 2020). This makes it difficult to identify female- and male-dominated occupations that are comparable across status levels. To address this constraint, we selected occupations that appeared strongly sex-typed based on informal cognitive pretests and included contextual information (e.g., leadership roles) to reinforce status signals. At the same time, our operationalization relied on occupational classifications from the German Classification of Occupations (KldB). While vignette job titles correspond to detailed occupational categories (5-digit level), information on gender composition is only available at a more aggregated level (4-digit level; (see BIBB, 2026)). Consequently, the gender distribution of the specific occupations presented in the vignettes may not perfectly match the distributions used to define the treatment conditions.
Taken together, these factors indicate that occupational gender composition is an imperfect proxy for perceived gender-typing. As a result, the experimental manipulation did not consistently generate the intended perceptual contrast, contributing to the attenuation of the estimated treatment effect.
Another set of explanations for our null finding relates to general challenges inherent to survey experiments. Even with attention checks, residual measurement error and satisficing behavior cannot be ruled out. In our factorial survey, respondents evaluated profiles that varied simultaneously across multiple dimensions, including occupation, attractiveness, and financial situation. Under these conditions, respondents may rely on simplifying heuristics and prioritize more salient or easily interpretable cues.
To assess whether discrepancies between actual and perceived gender composition reflect random error or systematic patterns of misperception, we therefore examined how respondent-level characteristics, vignette-level characteristics, and respondent behavior affect the correct classification of occupational gender composition. To do so, we created a binary indicator capturing whether respondents correctly classified occupations as either female- or male-dominated in a manipulation check administered at the end of the survey. Based on the 70% threshold we used to generate this indicator, we found that respondents correctly classified male-dominated occupations in about 70% of cases (n = 1138), but female-dominated occupations in only about 50% of cases (n = 775).1 This asymmetry indicates that misperception is not random but systematically biased toward underrecognizing female dominance.
Fig. 6, which presents linear probability model estimates of correct classification for female and male-dominated occupations (70% threshold), shows that respondents with higher education were 13–20 percentage points more likely to classify occupations correctly. However, we see almost no differences by respondent gender, gender attitudes, and age.
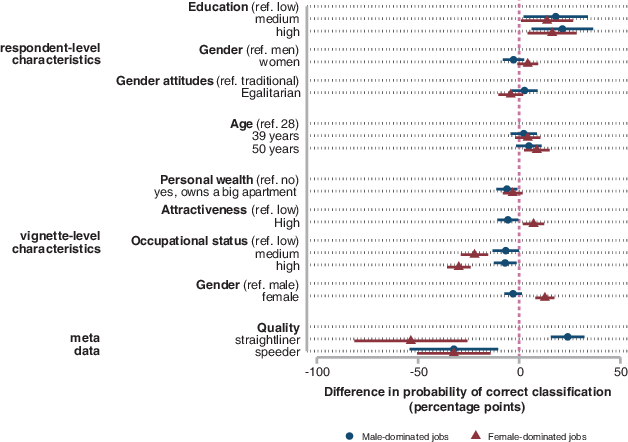
Fig. 6 Estimates of correctly predicting the gender composition of male and female-dominated occupations.Coefficients show the likelihood of correctly classifying occupational gender composition along with 95% CIs based on linear probability regressions with clustered robust standard errors (separate models for male and female-dominated occupations). Correct classification is defined as respondents correctly identifying whether at least 70% of workers in female-dominated occupations are women or 70% of workers in male-dominated occupations are men. These data were collected in the post-hoc questionnaire. The gender composition of female-dominated jobs was assessed 1555 times and of male-dominated jobs 1500 times; N = 611.
At the vignette level, we again find little variation by wealth and physical attractiveness. Differences by occupational status, however, are substantial: Respondents were substantially more likely to misclassify medium- and high-status female-dominated occupations than low-status female-dominated occupations (by approximately 25 percentage points). Moreover, classification accuracy for female-dominated occupations was higher when the vignette person was female rather than male (a 13-percentage-point difference). Lastly, the figure also shows that satisficing behaviors, namely speeding, defined as finishing the survey in less than 5 min (median response time was 11.57 min), also decreased the likelihood of correctly classifying an occupation’s gender composition. The reported effects of straightlining—measured in terms of no variation in any of the vignette assessment questions—are only based on a very small number of respondents (n = 7) and should therefore not be interpreted.
When examining the interaction between occupational status and vignette gender (Fig. 7), we find that respondents accurately identify the gender composition of low-status occupations, regardless of whether they are male- or female-dominated. In contrast, accuracy declines markedly for medium- and high-status female-dominated occupations, particularly when the vignette person is male. These patterns indicate that misperception is not random but systematically concentrated in medium- and high-status female-dominated occupations, where the intended treatment contrast is therefore weakest.
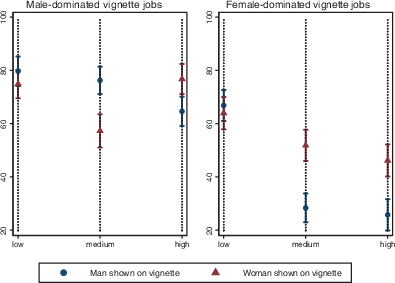
Fig. 7 Predicted probabilities of correctly predicting the gender composition of male and female-dominated jobs by occupational status and the gender of the person working in the occupation.The figure shows the predicted values of correctly classifying occupational gender composition (in percent) along with 95% CIs based on OLS regressions with clustered robust standard errors. Correct classification is defined as respondents correctly identifying whether at least 70% of workers in the occupation are women or men. Estimates are based on models including an interaction between occupational status and the gender of the vignette person and all vignette characteristics as well as respondent gender, education, and gender attitudes; separate regressions were estimated for female-dominated and male-dominated occupations; the gender composition of female-dominated jobs was assessed 1555 times and of male-dominated jobs 1500 times; N = 611.
A final set of explanations concerns design-specific features of our experiment that may have contributed to the divergence between the intended manipulation and respondents’ perceptions of the gender-typing of an occupation. First, to increase generalizability we used multiple occupations within each occupational gender-status treatment category rather than relying on a single occupation. While this approach improves external validity, it came at the expense of introducing heterogeneity in how respondents interpret the occupational cues: Different occupations within the same statistical category may evoke different perceptions of gender composition. In addition, our results indicate that respondents partly relied on the gender of the vignette person when inferring occupational gender composition, suggesting that person-level cues interacted with occupational information. Finally, because occupations were assigned within a limited number of vignette decks rather than fully randomized at the occupation level, the effective sample size per occupation was relatively small. This likely increased variance in classification and may have amplified discrepancies between intended and perceived occupational gender composition.
Second, two implementation-related issues may have further attenuated the estimated effects. Although the design ensured orthogonality at the level of experimental dimensions, it introduced partial confounding at the occupation level. Multiple occupations were nested within each occupational group and assigned across vignette decks. As a result, some occupations were only presented with either a male or a female vignette person, partially confounding occupation with vignette gender and making it difficult to disentangle their effects. In addition, the achieved sample size (N = 657) fell short of the planned 1200 respondents due to recruitment problems on the part of the survey company and exclusion following the attention checks. The substantially smaller sample size reduced the statistical power of the study. Taken together, these design features increased heterogeneity in how the treatment was perceived and, in some cases, introduced confounding with other key experimental dimensions, thereby further attenuating the effective treatment contrast.
This paper reports on a survey experiment that produced null results when examining whether women’s and men’s dating desirability differed by employment in gender-typical versus gender-atypical occupations. While we cannot rule out with certainty that this null effect indeed is not “evidence of absence,” we found several indications that it is rather an “absence of evidence” driven by several idiosyncratic features of our experimental design. First, the results of the survey experiment diverge from those of other components of our project, which consistently identify patterns indicative of a dating penalty for gender-atypical occupations. Second, respondents frequently did not interpret the experimental treatment—the gender-typing of an occupation—as intended. This misperception was not random but followed systematic patterns: participants were substantially less likely to correctly identify the gender composition of medium- and high-status female-dominated occupations, particularly when a man was shown in these roles.
Several structural, data-related, methodological, and design-specific features of our experiment may have contributed to this outcome. Rather than treating this outcome as a simple experimental failure, we view it as a diagnostic case from which others can learn how mismatches between intended and perceived treatments can arise and how such breakdowns can undermine experimental identification. Building on this insight, we derive a set of lessons for the design and interpretation of survey experiments.
The first lesson concerns the need to clearly specify and operationalize the estimand. The causal effect of interest in our study was the effect of occupational gender-typing on the vignette person’s perceived dating desirability. By assigning vignette persons to occupations with more than 70% or less than 30% women, we tested an intent-to-treat (ITT) rather than the average treatment effect (ATE) of occupational gender-typing, as not all respondents perceived the occupations to be gender-typical or gender-atypical as intended in the survey experimental design. Hence, as respondents did not perceive the treatment as intended, the null effect of occupational gender-typing likely reflects a failure of treatment reception rather than the absence of the underlying mechanism. Moreover, approximating occupational sex-typing using the proportion of women and men may have constituted an imperfect operationalization of the underlying construct, in contrast to what Adachi (2013) found for a much smaller selection of occupations for Japan. Researchers should therefore distinguish more explicitly between assigned and perceived treatments and consider whether their operationalization aligns with the theoretical construct it is intended to capture.
A second lesson relates to the trade-off researchers face between external and internal validity. By using a large and diverse set of occupations within the six occupational treatment conditions in our experiment, we aimed to generalize the results of our experiment as broadly as possible. However, this design choice reduced the perceptual clarity of the treatment, as not all occupations were unambiguously gender-typed and, in some cases, were partially confounded with the gender of the vignette person. In contrast, more stylized designs that rely on a smaller number of clearly gender-typed occupations may generate stronger and more interpretable treatment contrasts. Researchers should therefore carefully weigh these competing goals when designing their experiments.
A third lesson concerns the risks associated with operationalizing treatments using imperfect or incomplete data. In our case, we selected specific job titles for the vignettes and assumed that their gender composition corresponded to that of broader occupational categories for which data were available. This introduced measurement uncertainty into the treatment itself and prevented us from directly assessing how respondents’ perceptions of gender composition deviated from the true distributions at the level of the vignette occupations. Researchers should hence be cautious when constructing treatments from imperfect or aggregated data, as this can introduce unobserved measurement error that weakens treatment effects and obscures the sources of unexpected results.
A fourth lesson is that standard design practices—such as extensive pretesting and manipulation checks—are necessary but not sufficient when treatments rely on complex or context-dependent interpretations (Coleman, 2018; Green, 2022; Webster & Sell, 2014). Our study illustrates that even when these practices are carefully implemented, treatments may fail if they are not sufficiently strong or unambiguous. In our case, the decision to use a large and diverse set of occupations with varying and sometimes ambiguous gender-typing weakened the clarity of the manipulation, despite extensive pretesting. This experience suggests that researchers should not only pretest and validate their materials, but also ensure that treatments are sufficiently strong, interpretable, and consistently perceived across contexts and subgroups.
Taken together, our findings highlight a central challenge for survey experiments: when treatments rely on socially constructed categories, their effects depend not only on assignment but on how they are perceived. In our case, systematic misperceptions of occupational gender-typing weakened the intended treatment contrast and contributed to a null result, despite consistent evidence from other study components. Rather than viewing this as a simple failure, we interpret it as a diagnostic case that reveals how mismatches between operationalization and perception can undermine causal inference. More broadly, our study underscores the importance of aligning theoretical constructs, measurement, and respondents’ interpretations when designing experiments. By making these mechanisms explicit, we hope to contribute to a more careful and transparent use of survey experiments in the study of gender, occupations, and beyond.
Adachi, T. (2013). Occupational gender stereotypes: Is the ratio of women to men a powerful determinant. Psychological Reports, 112(2), 640–650. https://doi.org/10.2466/17.07.PR0.112.2.640-650. →
Alksnis, C., Desmarais, S., & Curtis, J. (2008). Workforce segregation and the gender wage gap: Is “women’s” work valued as highly as “men’s”? Journal of Applied Social Psychology, 38(6), 1416–1441. https://doi.org/10.1111/j.1559-1816.2008.00354.x. →
Anker, R. (1998). Gender and jobs: Sex segregation of occupations in the world. International Labour Office. a, b
Auspurg, K., & Brüderl, J. (2021). Has the credibility of the social sciences been credibly destroyed? Reanalyzing the “many analysts, one data set” project. Socius, 7, 23780231211024421. https://doi.org/10.1177/23780231211024421. →
Auspurg, K., & Hinz, T. (2015). Factorial survey experiments. SAGE Publications. →
Bächmann, A.-C. (2023). Are female-dominated occupations a secure option? Occupational gender segregation, accompanied occupational characteristics, and the risk of becoming unemployed. European Sociological Review, 39(6), 876–889. https://doi.org/10.1093/esr/jcac068. a, b, c
Baird, C. L. (2012). Going against the flow: A longitudinal study of the effects of cognitive skills and gender beliefs on occupational aspirations and outcomes. Sociological Forum, 27(4), 986–1009. https://doi.org/10.1111/j.1573-7861.2012.01365.x. →
Bajka, S. M., Combet, B., Emmenegger, P., & Seufert, S. (2025). Skill requirements versus workplace characteristics: Exploring the drivers of occupational gender segregation. Socio-Economic Review, 23(4), 2065–2086. https://doi.org/10.1093/ser/mwaf034. →
Bartnik, D., Gabriel, P. E., & Schmitz, S. (2022). The impact of occupational feminization on the gender wage gap and estimates of wage discrimination. Applied Economics Letters, 29(17), 1605–1609. https://doi.org/10.1080/13504851.2021.1949429. →
BIBB (2026). German Classification of Occupations 2010 (KldB 2010). Federal Institute for Vocational Education and Training (BIBB). https://metadaten.bibb.de/en/classification/detail/4 →
Block, P. (2023). Understanding the self-organization of occupational sex segregation with mobility networks. Social Networks, 73, 42–50. https://doi.org/10.1016/j.socnet.2022.12.004. →
Bosworth, S. J., & Della Giusta, M. (2024). When Matthew met Larry: Explaining the persistence of gender underrepresentation in high status organizations (Working Paper No. 17460). IZA Discussion Papers. https://www.econstor.eu/handle/10419/308319 →
Busch, F. (2017). Occupational devaluation due to feminization? Causal mechanics, effect heterogeneity, and evidence from the United States, 1960 to 2010. Social Forces, 96(3). https://doi.org/10.1093/sf/sox077. a, b
Buss, D. M. (1989). Sex differences in human mate preferences: Evolutionary hypotheses tested in 37 cultures. Behavioral and Brain Sciences, 12(1), 1–14. https://doi.org/10.1017/S0140525X00023992. Cambridge Core. →
Cohen, P. N. (2004). The gender division of labor: “Keeping house” and occupational segregation in the United States. Gender & Society, 18(2), 239–252. https://doi.org/10.1177/0891243203262037. a, b
Coleman, R. (2018). Designing experiments for the social sciences: How to plan, create, and execute research using experiments. SAGE Publications. →
Combet, B. (2024). Women’s aversion to majors that (seemingly) require systemizing skills causes gendered field of study choice. European Sociological Review, 40(2), 242–257. https://doi.org/10.1093/esr/jcad021. →
Ebner, N. C., Riediger, M., & Lindenberger, U., (2010). FACES—A database of facial expressions in young, middle-aged, and older men and women: Development and validation. Behavior Research Methods, 42(1), 351–362. https://doi.org/10.3758/BRM.42.1.351. →
England, P. (1992). Comparable worth: Theories and evidence. Aldine de Gruyter. a, b
England, P. (2010). The gender revolution: Uneven and stalled. Gender & Society, 24(2), 149–166. https://doi.org/10.1177/0891243210361475. →
England, P. (2011). Devaluation and the pay of comparable male and female occupations. In D. B. Grusky & S. Szelényi (Eds.), The Inequality Reader (2nd ed., pp. 421–425). Westview Press. a, b
Fales, M. R., Frederick, D. A., Garcia, J. R., Gildersleeve, K. A., Haselton, M. G., & Fisher, H. E. (2016). Mating markets and bargaining hands: Mate preferences for attractiveness and resources in two national US studies. Personality and Individual Differences, 88, 78–87. https://doi.org/10.1016/j.paid.2015.08.041. →
Feres, M., & Feres, M. F. N. (2023). Absence of evidence is not evidence of absence. Journal of Applied Oral Science, 31, ed001. https://doi.org/10.1590/1678-7757-2023-ed001. →
Froehlich, L., Olsson, M. I. T., Dorrough, A. R., & Martiny, S. E. (2020). Gender at work across nations: Men and women working in male-dominated and female-dominated occupations are differentially associated with agency and communion. Journal of Social Issues, 76(3), 484–511. https://doi.org/10.1111/josi.12390. →
Galos, D. R., & Strauss, S. (2023). Why do women opt for gender-atypical fields of study? The increasing role of income motivation over time. Higher Education, 85(4), 795–817. https://doi.org/10.1007/s10734-022-00866-0. →
Garcia-Mainar, I., Montuenga, V. M., & García-Martín, G. (2018). Occupational prestige and gender-occupational segregation. Work, Employment and Society, 32(2), 348–367. https://doi.org/10.1177/0950017017730528. a, b
Green, D. P. (2022). Social science experiments. Cambridge University Press. →
Hamjediers, M., & Peters, E. (2024). Gender compositions of occupations and firms jointly shape switches from gender-atypical towards more gender-typical positions. European Societies, 26(4), 1170–1194. https://doi.org/10.1080/14616696.2023.2290254. →
Heilman, M. E., Caleo, S., & Manzi, F. (2024). Women at work: Pathways from gender stereotypes to gender bias and discrimination. Annual Review of Organizational Psychology and Organizational Behavior, 11(1), 165–192. https://doi.org/10.1146/annurev-orgpsych-110721-034105. →
Hipp, L., Leumann, S., & Schober, P. S. (2024). Partnership penalties for working in gender—atypical occupations? Observational and experimental evidence from Germany. Working Paper. https://doi.org/10.31235/osf.io/ydurp. a, b
Hsiung, C. (2022). Gender-typed skill co-occurrence and occupational sex segregation: The case of professional occupations in the United States, 2011–2015. Gender & Society, 36(4), 469–497. https://doi.org/10.1177/08912432221102148. →
Jiang, W. (2025). The cultural devaluation of feminized work: The evolution of U.S. occupational prestige and gender typing in linguistic representations, 1900 to 2019. American Sociological Review, 90(5), 755–787. https://doi.org/10.1177/00031224251362351. →
Kay, M., Matuszek, C., & Munson, S. A. (2015). Unequal representation and gender stereotypes in image search results for occupations. Proceedings of the 33rd Annual ACM Conference on Human Factors in Computing Systems. https://doi.org/10.1145/2702123.2702520. →
Kohler, U., Class, F., & Sawert, T. (2024). Control variable selection in applied quantitative sociology: A critical review. European Sociological Review, 40(1), 173–186. https://doi.org/10.1093/esr/jcac078. →
Kricheli-Katz, T. (2019). Us versus them: The responses of managers to the feminization of high-status occupations. Socius: Sociological Research for a Dynamic World, 5, 2378023119878301. https://doi.org/10.1177/2378023119878301. →
Leuze, K., & Strauß, S. (2014). Female-typical subjects and their effect on wage inequalities among higher education graduates in Germany. European Societies, 16(2), 275–298. https://doi.org/10.1080/14616696.2012.748929. a, b, c
Leuze, K., & Strauß, S. (2016). Why do occupations dominated by women pay less? How ‘female-typical’ work tasks and working-time arrangements affect the gender wage gap among higher education graduates. Work, Employment and Society, 30(5), 802–820. https://doi.org/10.1177/0950017015624402. →
Levanon, A., England, P., & Allison, P. (2009). Occupational feminization and pay: Assessing causal dynamics using 1950–2000 US census data. Social Forces, 88(2), 865–891. https://doi.org/10.1353/sof.0.0264. →
Lundberg, I., Johnson, R., & Stewart, B. M. (2021). What is your estimand? Defining the target quantity connects statistical evidence to theory. American Sociological Review, 86(3), 532–565. https://doi.org/10.1177/00031224211004187. →
Magnusson, C. (2009). Gender, occupational prestige, and wages: A test of devaluation theory. European Sociological Review, 25(1), 87–101. https://doi.org/10.1093/esr/jcn035. a, b
Magnusson, C. (2013). More women, lower pay? Occupational sex composition, wages and wage growth. Acta Sociologica, 56(3), 227–245. https://doi.org/10.1177/0001699313484480. a, b
Matheus, C. C., & Quinn, E. (2017). Gender based occupational stereotypes: New behaviors, old attitudes. 2017 IEEE women in engineering (WIE) forum USA East, 1–6. https://ieeexplore.ieee.org/abstract/document/8285610 →
Oswald, P. A. (2003). Sex-typing and prestige ratings of occupations as indices of occupational stereotypes. Perceptual and Motor Skills, 97(3), 953–959. https://doi.org/10.2466/pms.2003.97.3.953. →
Puzio, A., & Valshtein, T. (2022). Gender segregation in culturally feminized work: Theory and evidence of boys’ capacity for care. Psychology of Men & Masculinities, 23(3), 271–284. https://doi.org/10.1037/men0000397. →
Ridgway, M., Oldridge, L., & Mavin, S. (2025). ‘Leading’ by example? Gendered language in human resource job adverts. Human Resource Management Journal, 35(1), 1–24. https://doi.org/10.1111/1748-8583.12549. →
Sebastián-Tirado, A., Félix-Esbrí, S., Forn, C., & Sanchis-Segura, C. (2023). Gender stereotypes selectively affect the remembering of highly valued professions. Sex Roles, 88(7–8), 326–347. https://doi.org/10.1007/s11199-023-01355-z. a, b
Simpson, R. (2004). Masculinity at work: The experiences of men in female dominated occupations. Work, Employment and Society, 18(2), 349–368. https://doi.org/10.1177/09500172004042773. →
Taflaga, M., & Kerby, M. (2020). Who does what work in a ministerial office: Politically appointed staff and the descriptive representation of women in Australian political offices, 1979–2010. Political Studies, 68(2), 463–485. https://doi.org/10.1177/0032321719853459. →
Thébaud, S., & Charles, M. (2018). Segregation, stereotypes, and STEM. Social Sciences, 7(7), 111. https://doi.org/10.3390/socsci7070111. →
Tophoven, S., du Prel, J. B., Peter, R., & Kretschmer, V. (2015). Working in gender-dominated occupations and depressive symptoms: Findings from the two age cohorts of the lidA study. Journal for Labour Market Research, 48(3), 247–262. https://doi.org/10.1007/s12651-014-0165-2. →
Webster, M., & Sell, J. (2014). Laboratory experiments in the social sciences. Elsevier. →