Online Supplementary Material including the data and a reproduction package is available at the OSF archive (https://doi.org/10.17605/osf.io/ugs72).
List experiments (also known as “item count technique” or “unmatched count technique”) aim to reduce social desirability bias and dishonesty with respect to sensitive survey questions by guaranteeing the respondents a high degree of anonymity (Droitcour et al., 2004). The participants are randomly divided into two groups (treatment and control group), each of which is presented with a list of items. The list for the control group contains only non-sensitive items, whereas the list for the treatment group additionally includes a sensitive item, which is intended to capture the information that the researchers are interested in. The respondents’ task is to state how many of the items apply to them, but not which ones. Thus, the researchers do not know whether any specific item applies to a respondent, giving the participants an increased level of privacy and making it easier for them to admit to the sensitive behavior, attitude, or experience in question. If the sample is large enough, the difference between the average responses of treatment and control group members can then be used to estimate the proportion of participants to whom the sensitive item applies (Glynn, 2013).
Over time, researchers have applied list experiments to a wide range of sensitive issues. Examples include drug use, being the victim of domestic violence or war crimes, support for genital mutilation, the prevalence of HIV, abortion, anti-gay sentiment, and racist attitudes and behaviors, the willingness to sell your vote, and compliance with social distancing measures during the Covid pandemic (Blair et al., 2014; Carkoglu and Aytac, 2015; Coffman et al., 2016; De Cao and Lutz, 2018; Kuklinski et al., 1997; Moseson et al., 2021; Munzert and Selb, 2020; Traunmueller et al., 2019; and Wolter and Laier, 2014). Meta-analyses show that the method often results in higher measures for the sensitive behaviors, experiences, or attitudes under investigation than direct questioning (Ehler et al., 2021; Li and Van den Noortgate, 2022). Due to this pattern, proponents of the list experiment technique have called it a “statistical truth serum” (Glynn, 2013).
Despite this reputation, the effectiveness of list experiments critically relies on two strong assumptions. First, the respondents’ reaction to the non-sensitive items must be unaffected by the presence of the sensitive item (no design effect). And second, their answer to the sensitive item must be honest (no liars) (Blair and Imai, 2012). These requirements may not always hold, however, especially if a study focuses on behavior that carries legal consequences if revealed rather than “merely” being socially undesirable, embarrassing, or stigmatizing. In such contexts, the list experiment may fail if the respondents distrust the privacy of the method and misreport deliberately.
This paper examines a case in which exactly that seems to have happened. We conducted a list experiment on corruption in the application process for a large international support program for Ukrainian micro companies after the full-scale Russian invasion in 2022. Corruption is a behavior for which direct questioning is unlikely to succeed (Heinrich and Hodess, 2011; Heywood, 2014). Yet our list experiment does not produce valid and conclusive results either: The respondents’ answers do not pass the test for design effects and the estimated prevalence of corruption is negative and cannot be interpreted meaningfully.1 We therefore cannot infer from the experiment whether corruption has taken place and to which extent. Further subgroup analyses show that this failure is largely driven by respondents representing companies that received grants, i.e., the group that seems likeliest to have benefited from any such machinations.
To examine more closely why the experiment failed, we ran a follow-up survey with representatives of the same companies nine months later. The results show that the respondents understood how to answer the experimental question correctly and interpreted our framing of “corruption” as intended. The observed pattern therefore suggests that the representatives of companies that most likely experienced corruption in the application process may have systematically and intentionally provided incorrect answers in the experiment. In other words, the failure of our experiment does not seem to originate in misunderstanding, but in deliberate evasion. In a sense, even an unsuccessful list experiment may therefore provide some indications of the underlying behavior of respondents.
Finally, we take a step back to check whether the outcome in our case points towards a potentially systematic limitation of list experiments. To this end, we conduct a limited systematic review of recent peer-reviewed articles that (a) contain “list experiment” or other names of the same technique in the title and (b) report the results of an original application of this method. Among the 44 papers included in the review, 37 (84%) focus on behaviors, experiences or attitudes that may be embarrassing, not socially accepted, stigmatized, or even traumatic, but without legal consequences for the respondents if their honest answer was revealed. By contrast, only 7 articles (16%) aim at measuring illegal behavior. This imbalance may reflect that behaviors with legal consequences are less interesting for researchers than non-consequential outcomes. It could also signal, however, that list experiments are less effective in general for topics bearing the risk of legal sanctions and therefore less publishable. As first tentative support for this interpretation, we observe that the share of articles in our data set stating methodological problems is higher for outcomes with legal consequences than for those without, although the difference is not statistically significant due to the small sample size.
With these findings, our paper contributes to the literature in three ways: First, it provides a comprehensive account of a failed list experiment in the hope that other researchers can learn from the experience. Second, by examining more closely several potential reasons for the failure, we show that respondents may strategically manipulate their answers even in a technique designed to protect anonymity. Careful subgroup analysis may help to identify subsets of individuals who are more likely to behave this way, which in some cases may provide interesting information in itself. Third, by situating this case within a broader review of published studies, we provide tentative evidence for potential limits to the suitability of list experiments to study behaviors with legal consequences. We conclude by encouraging researchers to preregister all list experiments in publicly accessible platforms to reduce potential publication bias and enable more comprehensive and rigorous meta-research about when and why the method works.
The remainder of this paper is organized as follows: First, we briefly introduce the background of our list experiment (Section 2) and describe our experimental design in more detail (Section 3). Then, we present the results of the initial study (Section 4) for the whole sample and by subgroups of grant recipients and unsuccessful applicants. In Section 5, we document the findings of the follow-up survey to examine possible explanations for the failure of the experiment. Section 6 discusses our results against a systematic review of 44 applications of list experiments published in the last 10 years. Section 7 concludes.
Our study examines the presence and extent of corruption in the application and selection process of the ReACT4UA/EU4B micro grant program for SMEs in Ukraine (“EU4B micro grant program” in the following).2 This international support program offered very small companies with at most nine employees up to 4000 Euro in non-repayable grants starting in 2022. Given that the average monthly salary of a full-time employee in that year was around 400 Euro (14,600 Ukrainian Hryvnia; State Statistics Service of Ukraine, 2022), this sum represented a substantial amount. It could be used for paying wages, replacing or purchasing equipment, as well as advisory and certification services within a period of six months.3
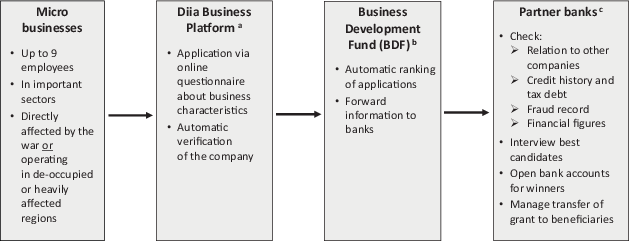
For the list experiment, we use the 2022 and 2023 cohorts of the program. In both years, interested entrepreneurs could apply for the grants via an online platform of the Ukrainian Ministry of Digital Transformation (the Diia Business Platform). They had to provide personal information, company details, and a proposal outlining the planned use of the grant funds. The online portal automatically checked the applicants’ eligibility, filtered out cases that clearly missed formal requirements, and forwarded all other applications to an implementing agency.4 The selection of recipients then involved external experts and local banks, using criteria like eligibility, lack of prior public funding, and application quality, and paying particular attention to companies that were relevant for the military or covered basic needs of the population.
Fig. 1 illustrates the steps of this process in 2023, the year in which most companies in our sample applied. Here, three local partner banks (Oschadbank, Privatbank, and Bank Lviv) additionally checked the statements in the submitted documents against registration data, verified the submitted financial data, and looked for any evidence of fraud in the tax and credit history as well as potential institutional ties to larger companies.
Where could corruption and bribery enter this picture? As informal and illegal payments have been an important issue in Ukraine since the 1990s,5 the designers and administrators of the EU4B micro grant program attempted to minimize individual discretion by using an online portal, automated eligibility checks, and algorithmic or panel-based scoring. However, the important step of verifying the submitted information and checking the legal and financial background of the applicants still relied on individuals (staff assisting the implementing agencies with the selection of the grant recipients in 2022 and bank employees in 2023). As these actors retained considerable discretion in assessing and rejecting applicants and operated without close supervision, this phase was the most plausible point at which corruption could have occurred.
Bribing officials or persons who work together with official bodies such as bank employees is illegal in Ukraine and may result in up to two years of imprisonment.6 Respondents are therefore very unlikely to admit such behavior in direct questioning (Detkova et al., 2021; Krumpal, 2013; Tourangeau and Yan, 2007). To obtain information about possible corruption nevertheless, we included a list experiment in a survey of companies that applied to the EU4B micro grant program in 2022 or 2023.7 The survey was conducted by the Ukrainian market research company Rating Group using the push-to-web method (P2W).8 It ran between December 2023 and March 2024 with the goal to record the economic situation of the companies in the time of war, gather feedback on the implementation of the EU4B program, and collect information for a later impact evaluation.9
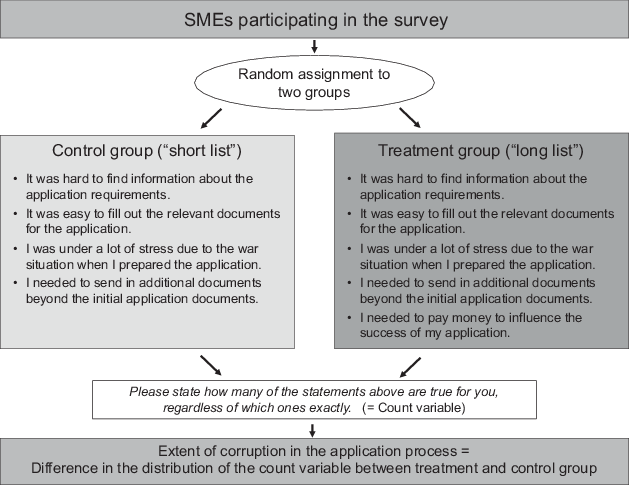
Fig. 2 illustrates the design of the experiment, including the exact wording of the statements and instructions. The survey software randomly assigned respondents to either treatment or control group. The control group faced a list of statements about non-sensitive possible experiences during the application process for the micro grants or issues their companies may have had at the time of application (the “short list”). The treatment group received the same list plus the sensitive item: “I needed to pay money to influence the success of my application” (the “long list”).10 Both groups were asked how many of the items applied to them, but not which ones. This ensured that the individual responses remained confidential, except in the rare cases in which respondents indicated either zero or all possible items in the respective group. At the group level, however, it is possible to estimate the share of applicants who needed to pay money to advance their application from the difference in the average number of items reported between treatment and control group (Blair and Imai, 2012; Imai, 2011; Tsai, 2019).
Estimates for sensitive items in list experiments such as ours are unbiased if three conditions hold (Blair and Imai, 2012):
Random assignment: The respondents are randomly allocated to the two groups such that they form credible counterfactuals.
No design effects: The respondents do not change their response to the non-sensitive items depending on whether the sensitive item is included. If this happened, we would confound the measure for the sensitive item with the participants’ change in their statements to the non-sensitive ones.
No liars: The respondents in the treatment group do not deliberately misreport the sensitive item.
Requirements (1) and (2) can be tested statistically (see Section 4), but condition (3) cannot. Applied researchers therefore typically rely on the “more-is-better” criterion (Tourangeau and Yan, 2007) to assess the success of the list experiment: If the list experiment produces a higher estimate of the sensitive outcome of interest than direct questioning, it is considered to have at least increased the proportion of respondents who tell the truth.
In designing the experiment, we closely followed the recommendations and best practices in the literature to reduce the risk of violating the three requirements for identification (Droitcour et al., 1991; Glynn, 2013; Hinsley et al., 2019; Kuklinski et al., 1997): First, the topic of the survey does not relate to the purpose of the experiment and should thus not have led to selective participation. Second, we offered the survey in both Ukrainian and Russian to minimize any language-related barriers. Third, we embedded the list experiment in a section on the respondents’ experiences with the application and decision-making process so that it does not stand out and draws attention. Fourth, we use four non-sensitive items for the short list to balance the competing interests of masking the sensitive item on the one hand and keeping the cognitive load for the respondents and the variation in the outcome variable at acceptable levels on the other. Fifth, the non-sensitive items relate to the sensitive one in terms of topic and wording to have a natural feel in the long list. Sixth, we chose the non-sensitive items 1 and 2 such that they are negatively correlated and stated item 3 so that it is highly likely to apply to the respondents. With this combination, we expected that most of the answers lie between “1” and “3”, which reduces the risk of floor or ceiling effects.11 Seventh, we talked to several Ukrainian natives and phrased the sensitive item in a way that clearly relates to corruption but could potentially also include legal expenditures to give the respondents additional cover. Finally, for the sake of transparency and open science, we pre-registered the study and its intended analyses at AsPredicted.org under number 155861 (https://aspredicted.org/3sf7-k6bq.pdf). Due to the challenging task of having to evaluate a support program in a war environment with limited time, we did not pilot the experiment, however, nor did we use a double list design12 to increase the precision of the estimation.
In total, 2484 companies that applied for the EU4B micro grant program in 2022 or 2023 were contacted for the survey. Representatives of 1495 of them completed the questionnaire (60%) and 1457 answered the list experiment (98% of respondents).13 The survey software’s random allocation mechanism successfully created treatment and control groups of about the same size, with 716 and 741 members, respectively (49% and 51% of the respondents). Likewise, the two groups are very similar with respect to a large number of relevant observable characteristics. These include the status in the program, the mode of participation in the survey (online or on the phone), information provided in the survey, the industry sector, and the oblast in which the company was active at the time of the application. Overall, we observe only two statistically significant differences (at the 10% level) between the two groups across 50 comparisons.14 This shows that the random allocation of survey participants worked very well, fulfilling condition (1) for the validity of the experiment.
Unfortunately, we cannot say the same for condition (2), the requirement that participants in the experiment are not influenced in their answers to the non-sensitive statements by whether they see the statement on corruption in the application process. If this requirement is met, the distribution of answers in the treatment group should be similar to or lie to the right of the distribution of answers in the control group. Fig. 3 shows, however, that this condition is not fulfilled in our case. On the left-hand side of the distribution, the share of respondents stating “0” is noticeably higher in the treatment than in the control group (21% vs. 17%), although it should be lower or at least very similar. Likewise, the fraction of long-list respondents on the right-hand side of the distribution (i.e., those stating “4” or “5”) is lower than the share of people answering “4” in the short-list group (7% vs. 10%), although it should be at least as large.
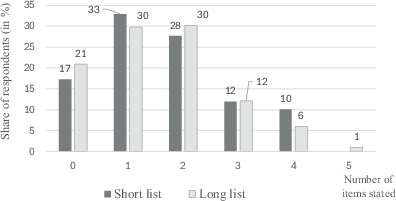
Fig. 3 Distribution of Count variable across experimental groups716 companies answered in the “Long list” condition (“treatment group”), 741 in the “Short list” (“control group”).Source: ifm/CES (2024a).
We can use the procedure presented in Tsai (2019) to empirically test whether these deviations in response behavior are driven by coincidence. The idea behind this test is to examine the differences between the distributions of answers of the treatment and the control group (“long” and “short”, respectively). If the participants answered honestly to the non-sensitive items irrespective of whether the sensitive item is present (no design effects), the share of a given response (e.g., “3”) in the treatment group should not be significantly smaller than in the control group after accounting for two aspects: (1) respondents shifting from “2” to “3” due to the sensitive item, and (2) respondents who change from “3” to “4” when the sensitive item applies to them. The test rejects this hypothesis with a p-value of 0.025, which suggests that some respondents in the treatment group intentionally reported lower counts to the survey question.15 The experimental design thus failed to convince the survey respondents to provide accurate information on their experiences in the application process.
The results of a standard linear regression analysis (OLS) reinforce this conclusion. As reported in column (1) of Table 1, a regression of the Count variable on a simple indicator of treatment status (i.e., whether a respondent faced the “long” list with the sensitive item) yields an estimated coefficient of −0.093 (p-value = 0.131). Column (2) displays the results of the preregistered main specification, in which we control for relevant characteristics of the applying entrepreneurs and their firms (gender of the applicant, firm age, number of employees at the end of 2021, industry sector, and the oblast (Ukrainian region) in which the company was active) and which bank checked the application.16 Adding these variables does not change the estimate much (−0.082, p‑value = 0.191), providing another proof that the random assignment worked as intended. In column (3), we further include information on grant receipt, survey mode and language, the application score and whether the firm was still active at the time of the survey. The result is the same again (−0.076, p‑value = 0.222).17 Taken literally, this means that the share of respondents who needed to pay money to advance their company’s application is estimated at about −8%, which is outside the range of possible values (although not significantly different from 0).18 As such, the results of the experiment cannot provide evidence for whether corruption took place in the selection of recipients for the EU4B micro grant program.19
Table 1 Main results—list experiment
All participants | Grant recipients | Unsuccessful applicants | |||
DV: Count | (1) | (2) | (3) | (4) | (5) |
Robust standard errors in parentheses a A small number of companies did not state their number of employees at the end of 2021. To prevent the loss of these observations, we replaced the missing values by the variable mean and added a binary variable indicating this imputation b Applications from 2022 (without bank checks) and those checked by Bank Lviv form the baseline group c Respondents who did not participate in the online survey after repeated reminders were interviewed on the phon d Respondents could choose to take the survey in Ukrainian or Russian to accommodate the Russian-speaking minority e The automatically generated application score for the 2023 cohort is censored at the 5th percentile and then mapped into the 30–100 range of the 2022 cohort * p ≤ 0.05 | |||||
Treatment (“long list”) | −0.093 | −0.082 | −0.076 | −0.169* | −0.002 |
(0.062) | (0.062) | (0.062) | (0.079) | (0.102) | |
Female applicant | – | 0.034 | 0.039 | 0.067 | −0.033 |
– | (0.065) | (0.065) | (0.082) | (0.109) | |
Age of firm [in years] | – | −0.004 | −0.004 | −0.001 | −0.007 |
– | (0.004) | (0.005) | (0.006) | (0.007) | |
No. of employees (end of 2021) | – | −0.003 | −0.003 | −0.002 | −0.004 |
– | (0.004) | (0.004) | (0.004) | (0.010) | |
No. of employees imputed a | – | −0.196 | 0.155 | −0.251 | – |
– | (0.332) | (0.414) | (0.317) | – | |
Applic. checked by Oschadbank b | – | −0.114 | 0.174 | −0.132 | −0.311 |
– | (0.097) | (0.138) | (0.116) | (0.264) | |
Applic. checked by Privatbank b | – | 0.064 | 0.312* | 0.053 | −0.166 |
– | (0.091) | (0.129) | (0.111) | (0.261) | |
Successful application | – | – | −0.075 | – | – |
– | – | (0.073) | – | – | |
Survey answered online c | – | – | 0.226* | – | – |
– | – | (0.097) | – | – | |
Language of survey: Ukrainian d | – | – | 0.015 | – | – |
– | – | (0.202) | – | – | |
Company still active | – | – | 0.355 | – | – |
– | – | (0.246) | – | – | |
Application score e | – | – | 0.011* | – | – |
– | – | (0.004) | – | – | |
Constant | 1.648* | 1.443* | 0.045 | 2.352* | 2.362* |
(0.044) | (0.535) | (0.711) | (0.478) | (0.637) | |
Industry sector | No | Yes | Yes | Yes | Yes |
Region (oblast) | No | Yes | Yes | Yes | Yes |
Adj. R2 | 0.001 | 0.017 | 0.024 | 0.035 | 0.018 |
N | 1457 | 1457 | 1457 | 821 | 636 |
In the following, we examine possible reasons for the failure of our experiment.20 We start with separate analyses for recipients and non-recipients of the grant based on the assumption that the final recipients of the EU4B micro grants are more likely to have been involved in an act of bribery and have to fear stronger consequences if their participation were revealed to the program officials and public authorities. In consequence, they may be very cautious with respect to our item of interest and thus limit the usefulness of the list experiment approach (Blair et al., 2020; Kramon and Weghorst, 2019; Wolter and Laier, 2014).
For the subgroup analysis, we first run the Tsai (2019) test separately for the two groups. The results show statistically significant deviations in the response behavior of grant recipients from what we would expect if the no-design-effects and no-liars assumptions hold (p = 0.023), whereas this is not the case for the group of unsuccessful applicants (p = 0.129). Second, we estimate the pre-registered specification (column 2 in Table 1) separately for the two groups. The results in columns (4) and (5) of Table 1 show the same pattern we obtained with the Tsai test: While we see a negative and significant estimate for the impact of being assigned to the long list on the reported count variable (b = −0.169, p = 0.033) among recipients (column 4), we get a coefficient that is basically 0 and statistically insignificant for the non-recipients (b = −0.002, p = 0.984; see column 5).
In sum, these results suggest that the probability that our list experiment failed by accident is very small. On the contrary, it seems that a non-negligible number of grant recipients answered the experiment in a way that countered its purpose to measure the extent of corruption in the application and selection process of the support program. The results do not tell us why they behave this way, however. Did some grant recipients bribe their way into the program and overshot in their attempt to hide this? Were grant recipients simply concerned that any measure of corruption in a support program would risk a stop or reduction of international aid to Ukrainian SMEs even if they did not actually bribe anyone? Or are more technical reasons responsible for the different response behaviors of recipients and non-recipients, for instance, that they varied in their understanding of the list experiment or the sensitive item? Unfortunately, we cannot give an exact answer to the first two questions as we cannot identify the individuals whose answers drive our results and do not know the motives for their behavior. The following section therefore concentrates on the more methodological aspects that could be behind our findings.
Given the failure of the experiment, we want to find out more about how the participants answered the list experiment to learn something for future applications of this method.21 In particular, we want to answer the following three questions:
Did the participants understand how to answer the list experiment correctly?
Did they interpret the sensitive item as intended?
Could we have obtained more insightful results if we had asked the corruption question directly?
To do so, we take advantage of a follow-up survey of the same group of Ukrainian SMEs in October 2024, i.e., roughly nine months after the initial data collection.22 A total of 903 (62%) of the 1457 original respondents of the list experiment participated again. In the following, we call these respondents “panelists” in contrast to the “dropouts” who did not take part in the second survey as well. Although a larger proportion of grant recipients than non-recipients took part in the repeat survey (70% vs. 52%, respectively), we see that the panelists are very similar to the dropouts in their characteristics (see Table B.5 in the Online Supplementary Material). The two groups differ only with respect to the mode of participation in the first wave of the survey (92% of the panelists answered the questionnaire online compared to 89% of the dropouts). On the other hand, there are no differences between the groups with respect to the language chosen for answering the survey, the survival of the company, the gender of the entrepreneurs, the size of the company, the application score and the bank handling the application. We are therefore confident that the results of the follow-up survey hold for most of the respondents in the initial experiment, especially when we distinguish between grant recipients and non-recipients.
In the follow-up survey, we lean on Corstange (2009) and Kramon and Weghorst (2019) and presented the four non-sensitive items of the original list experiment to the respondents as separate direct questions.23 We use their answers to generate a new variable (Score) ranging from “0” to “4” with “0” indicating that the respondent answered none of the questions affirmatively and “4” that the respondent agreed with each statement. For the control group of the experiment, i.e., those participants who only saw the short list of four items, we expect Score to be equivalent to the Count variable from the experiment. We can therefore use Score to check whether the respondents understood and answered the list experiment correctly when they did not see the sensitive item on corruption.
Starting with the average values, we see that the numbers are similar, with Score having a slightly higher mean than Count (1.76 to 1.66, with a p-value of 0.097 for a two-sided t‑test of equal means). On the aggregate level, it thus seems that we capture the correct information with the experiment. Running a regression of Count on Score also produces a statistically significant correlation between the two variables on the individual level (b = 0.192, p = 0.005). Keeping in mind that people’s memories about their situation at the time of applying to the grant program may have faded during the nine months between the two surveys, and that any deviations in the cases of respondents who answered “0” or “4” in the experiment must by definition shift towards intermediate values (see the discussion of non-strategic respondent error in Kramon and Weghorst, 2019), this appears to be a strong indication that the company representatives knew how to answer the original list experiment correctly.
Equally important for us, we also see that grant recipients and non-recipients behave very similarly in this respect. When we add an indicator for grantee status and its interaction with Score to the regression model, the coefficient of the interaction is small and statistically insignificant (b = 0.026, p = 0.853). This means that we can expect the representatives of the two groups of companies to state the same number of experiences with the non-sensitive items in the “long list”-condition as well, such that the only reason for the observed difference is the reaction of respondents to the sensitive item about corruption.
Next, we examine whether the company representatives in our study may have understood the sensitive item in a way we did not intend. As we tried to phrase the statement in a general way (“I needed to pay money to influence the success of my application”) that clearly alludes to corruption but could also include some perfectly legal expenditures, there is some wiggle room with respect to how people interpret it.24 We therefore asked the respondents of the follow-up survey whether they agree or disagree with four statements that cover the most relevant possibilities for small companies to legally spend money to “influence the success” of their application:
I needed to hire an external consultant/help to fill out the application documents.
I needed to pay a fee to submit my application online.
I needed to pay a fee so that the local bank could check my credit and tax history.
I needed to pay a fee to open a bank account for the grant.
Figure 4 depicts the answers of the respondents by group status in the experiment and whether they received the EU4B micro grant. The results show that a substantial fraction of company representatives incurred additional costs in the application process, in particular from hiring external consultants to prepare the application. Across all respondents, 35% reported to have had to spend money on at least one of these categories. Apparently, it does not play a role whether a respondent faced the sensitive item in the experiment, but representatives of non-recipient companies seem to have had more of these additional costs than those of grant recipients (45% stated at least one of the categories compared to 30% among grantees).
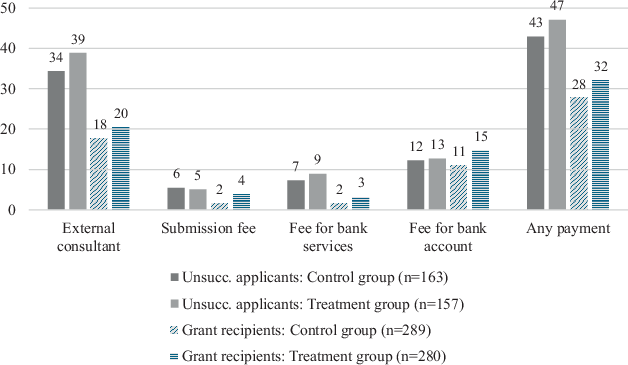
Fig. 4 Share of respondents reporting to have incurred different types of legal costs (in %).Source: ifm/CES (2024b).
With respect to the outcome of the experiment, these numbers tell us that the surveyed respondents do not seem to have a general problem with answering questions regarding expenditures for their grant application. It is therefore very likely that they would have also included these cost items in their answer to the list experiment if they had interpreted the sensitive item along these lines. In that scenario, we would expect to obtain a positive measure of between 4% and 35%, depending on which legal expenditure they considered to fit the statement. Since this is not even remotely the case, we conclude that the respondents understood the sensitive item in the list experiment as not belonging to these cost categories.
Finally, we wanted to know whether we could have used direct questions about corruption in the application and decision process of the EU4B micro grant program instead of applying the more complicated list experiment with a broadly phrased sensitive item. To this end, we included two statements in the follow-up survey to shed light on the potential existence and extent of corruption and whether it was initiated by the applicants or some person in a decision role: (1) “I had to offer a bribe in order to advance my application” and (2) “I was asked to pay a bribe in order to advance my application”.25 We asked the respondents again to indicate whether they agree or disagree with the respective statement. To avoid any mutual influence between the two questions, we presented only one statement to each respondent at random.26
The results show very low shares of respondents who agreed with these statements. For both versions of the direct question, only 1% of respondents admitted to the respective behavior or experience. On the one hand, these answers suggest that it does not really matter in this case whether we describe the role of the respondent as an active or passive one. On the other hand, the results alone do not tell us whether the respondents do not want to openly admit illegal behavior or whether the program was simply implemented very well and according to the intentions and rules of the designers.
Fig. 5 therefore displays the percentage of respondents who agreed with the two statements separately for recipients and non-recipients of the EU4B micro grants. It shows that among the non-recipients, 4% stated to have offered a bribe and 3% to have been asked to pay a bribe. By contrast, not a single recipient admitted having actively offered a bribe and only 2 out of 288 (1%) indicated they had been asked to pay a bribe. This suggests that we would not have obtained substantially different and more credible results if we had asked our questions directly.
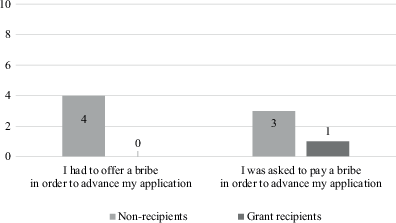
Fig. 5 Measures for corruption experience through direct questioning (in %).Source: ifm/CES (2024b).
In sum, the findings obtained through the subgroup analyses and the follow-up survey help us to narrow down the possible reasons for the failure of the list experiment on corruption in the application process to an international support program for SMEs in Ukraine. We are confident that the participants understood how to answer the experiment and what the sensitive item in the list meant. Likewise, we see that the experimental results lie roughly 10 percentage points below the already very low and most likely underreported responses to the direct questions. Finally, it is the group of grant recipients who single-handedly drives this result, i.e., the group of people that may have benefited the most from the sensitive behavior under examination. It therefore seems very likely that a fraction of participants intentionally adjusted their answer in response to facing the sensitive item on corruption and that this fraction is heavily concentrated among the grant recipients.
Several factors may have contributed to the failure of our experiment, some of which are likely specific to the topic of corruption and the circumstances in Ukraine at the time of our study. Following the discussion and reasoning in recent articles on list experiments (e.g., Hinsley et al., 2019; Jerke et al., 2022; Moseson et al., 2021; Wolter and Laier, 2014), however, we also need to consider the possibility that list experiments may not be very effective in general in measuring behavior that is clearly illegal and could have severe personal consequences if revealed to local authorities or program administrators. A comprehensive and rigorous test of this possible boundary condition for list experiments is beyond the scope of this paper. Nevertheless, we undertake a first exploratory check to see whether we observe this pattern in the wider literature as well.
To this end, we conduct a targeted systematic review of recent research articles using list experiments. More specifically, we want to know the share of papers studying sensitive behaviors with potential adverse consequences as well as whether examining such an outcome is associated with a higher frequency of reporting methodological problems in the implementation of the experiment. The articles for this review stem from the Web of Science portal where we searched for English-language articles published between 2014 and 2024 that include the phrases “list experiment”, “item count technique”, or “unmatched count” in the title of the paper.27 We only consider studies that conduct an own list experiment and exclude purely theoretical or methodological papers. Using these restrictions, we end up with a sample of 44 articles.28 We divide them into groups depending on the nature of the sensitive item examined (own experiences, attitudes, and behavior) and whether the respective topic leads to adverse legal consequences for the respondents if revealed. Likewise, we code whether an article reports problems with the identification requirements of list experiments, that is, unequal comparison groups, the presence of design effects, floor or ceiling effects, or experimental results that lie below the results of direct questioning.
Fig. 6 displays the outcomes of this exercise. With respect to the sensitive items investigated, 24 articles in our sample study behaviors, 13 look at attitudes, and 7 measure own experiences, current situations, or self-reported identities. Additionally, we classify 17 of the 24 sensitive behaviors as inconsequential, that is, embarrassing, not socially accepted, stigmatized, or even traumatic, but without direct negative consequences for the respondents if revealed. The remaining 7 articles use list experiments to measure an outcome that could result in some form of sanctions or punishment if some authority would get to know the exact answer of the respondents. This includes academic misconduct among Iranian academics (Jerke et al., 2022), drug and alcohol consumption as well as extra-marital intercourse among women in Iran (Bahadivand et al., 2020), driving-related misbehavior in Germany (Wolter and Laier, 2014), selling infected-meat in Madagascar (Randrianantoandro et al., 2015), abortion prevalence in Pakistan (Huber-Krum et al., 2020), prenatal sex determination and sex-selective abortion in Vietnam (Treleaven et al., 2021), and abortion incidence in Malawi and Senegal (Moseson et al., 2021).
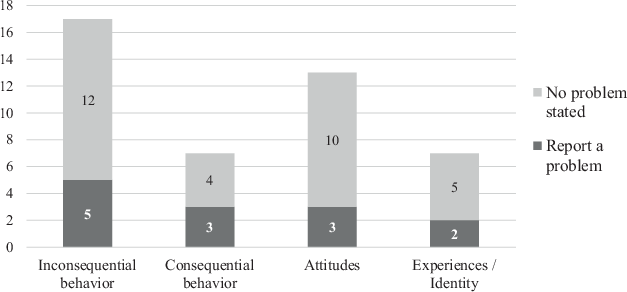
Fig. 6 Frequencies of methodological problems reported in recent published list experiments.“Methodological problems” include (1) unbalanced comparison groups, (2) design effects, (3) floor of ceiling effects, (4) results outside the 0–1 range, and (5) results lower than the answers to a direct question with the same wording. “Consequential behavior” contains articles that examine respondents’ own behavior that clearly violates existing laws in the respective country and would trigger negative consequences if it became known to the authorities.Source: Literature review of recent publications using list experiments found via Web of Science (publication years 2014–2024, name of method in the title, n = 44), own coding and calculations
With respect to the results of these articles, the dark grey area of each column in Fig. 6 represents the number of papers per category that reported any of the methodological problems listed above (unequal comparison groups, design effects, floor or ceiling effects, and results below direct questioning or outside the 0–1 range) for their respective list experiment.29 Overall, this is the case for 13 of the 44 reviewed articles (30%). Across categories, the respective shares are 23% for sensitive attitudes, 29% for experiences, current situations, and identity questions, 29% for inconsequential behavior, and 43% for consequential behavior.
Although our sample is surely not comprehensive, these numbers provide us with two interesting observations that give us a first indication of whether illegal behavior may be a boundary case for the use of list experiments. First, we see that the number of publications that focus on this kind of sensitive item is relatively low (only 16% of our sample). On the one hand, this could be an expression of low relevance and interest in these topics. On the other hand, it could also reflect an even larger degree of sensitivity and vulnerability among respondents in these settings that makes any investigation extremely challenging. Or in the introductory words of Corstange (2009, p. 45): “Racism, terrorism, corruption: political questions can be sensitive, and what makes them interesting is also what makes them sensitive. Yet what makes them sensitive also makes them difficult to study.” The relative scarcity of such studies could therefore point in that direction, especially when we take into account that experiments with methodological problems usually have a smaller chance to get published due to the profession’s preference for studies that worked properly and produced significant results (see the results and statements in Blair et al., 2020, Dwan et al., 2013, and Hinsley et al., 2019).
Second, despite the challenge of publishing studies that contain complications, the share of papers reporting problems with the conditions for validity of list experiment is highest among articles investigating consequential outcomes (43% vs. 27% for the non-consequential outcomes together). Due to the small sample size, this difference is not statistically significant (the p‑value in a two-sided t‑test is 0.445). If this pattern was confirmed in a larger review, however, it would provide another sign of the difficulties associated with the use of list experiments to measure outcomes that can potentially lead to adverse consequences.
For a more rigorous test, we would have to collect more comprehensive set of papers, both for published list experiments (using more sources for this task and a longer time period as well as applying the search terms also on abstracts and keywords) and most importantly unpublished ones (e.g., looking at preregistrations, working papers, and conference and seminar presentations; see Blair et al., 2020). We could then classify the sensitive items and track the outcomes of these studies in terms of the results itself but also whether they get published at all. To enable such investigation in the future, we therefore encourage researchers to preregister all their attempts to use list experiments in a publicly accessible platform.
In this paper, we report our experience of using a list experiment to measure corruption in the application process for an international support program for SMEs in Ukraine after the Russian invasion in 2022. The results of the experiment do not fulfill the validity conditions, but careful analysis of the data and a follow-up survey among the participants leads to an interesting insight nevertheless: List experiments may have great potential when they are used to examine topics that are socially undesirable, embarrassing, or stigmatized, but they seem much less effective in situations in which the sensitive item is clearly and understandably illegal and may have consequences for the participants themselves if their behavior is revealed.
A first limited test provides some tentative support for this potential boundary condition. Looking at 44 articles reporting the outcomes of list experiments in the time period 2014–2024, we see that the number of published papers examining consequential behavior is relatively small, despite the large public interest and potential relevance. Likewise, these articles are more likely to state problems with the validity conditions than papers that measure non-consequential outcomes, although the difference is not statistically significant due to the small sample size.
Future research should take these considerations into account. On the one hand, by testing the hypothesis made here more rigorously. To this end, we strongly recommend that researchers publicly pre-register all their attempts with list experiments to reduce the publication bias in literature reviews and meta-studies and enable more comprehensive and rigorous analyses of the successes and failures of this method in different areas. On the other, by thinking about possible alternatives to studying consequential outcomes directly. This could be to phrase the sensitive item in a way that targets the antecedents (like attitudes about it or the general willingness to act) or negative personal consequences of illegal behavior (having been exposed to or victim of it) instead of the real behavior. Finally, if the subject of a study must be a consequential outcome, we recommend following the guidelines laid out by Hinsley et al. (2019) on when to use list experiments and how to design and implement them. Trying out reverse formulations of behaviors with legal consequences à la Coffman et al. (2016) may also contribute to better results, although at the risk of artificially inflating the estimates (Kiewiet de Jonge and Nickerson, 2014).
We gratefully acknowledge financial support from the Deutsche Gesellschaft für Internationale Zusammenarbeit GmbH (GIZ) under grant no. 81289244. The funder facilitated access to program data, but had no role in study design, data collection and analysis, decision to publish, or preparation of the manuscript. Furthermore, we want to thank Esra Güllü, Volodymyr Landa, Nino Petriashvili, and Jonathan Vincent for valuable input and feedback as well as Kateryna Butyrina and Vladyslava Gorba for their excellent research assistance.
The experiment received approval from the Ethics Committee of the University of Mannheim (EK 46/2023) and is preregistered at AsPredicted.org under number 155861 (https://aspredicted.org/3sf7-k6bq.pdf).
Ahlquist, J. S. (2018). List experiment design, non-strategic respondent error, and item count technique estimators. Political Analysis, 26(1), 34–53. https://doi.org/10.1017/pan.2017.31. →
Bahadivand, S., Doosti-Irani, A., Karami, M., Qorbani, M., & Mohammadi, Y. (2020). Prevalence of high-risk behaviors in reproductive age women in Alborz province in 2019 using unmatched count technique. BMC Women’s Health, 20(1), 186. https://doi.org/10.1186/s12905-020-01056-9. →
Blair, G., & Imai, K. (2012). Statistical analysis of list experiments. Political Analysis, 20(1), 47–77. https://doi.org/10.1093/pan/mpr048. a, b, c
Blair, G., Imai, K., & Lyall, J. (2014). Comparing and combining list and endorsement experiments: Evidence from Afghanistan. American Journal of Political Science, 58(4), 1043–1063. https://doi.org/10.1111/ajps.12086. →
Blair, G., Coppock, A., & Moor, M. (2020). When to worry about sensitivity bias: A social reference theory and evidence from 30 years of list experiments. American Political Science Review, 114(4), 1297–1315. https://doi.org/10.1017/S0003055420000374. a, b, c
Carkoglu, A., & Aytac, S. E. (2015). Who gets targeted for vote-buying? Evidence from an augmented list experiment in Turkey. European Political Science Review, 7(4), 547–566. https://doi.org/10.1017/S1755773914000320. →
Coffman, K. B., Coffman, L. C., & Marzilli Ericson, K. M. (2016). The size of the LGBT population and the magnitude of antigay sentiment are substantially underestimated. Management Science, 63(10), 3147–3529. https://doi.org/10.1287/mnsc.2016.2503. a, b
Corstange, D. (2009). Sensitive questions, truthful answers? Modeling the list experiment with LISTIT. Political Analysis, 17(1), 45–63. https://doi.org/10.1093/pan/mpn013. a, b
De Cao, E., & Lutz, C. (2018). Sensitive survey questions: Measuring attitudes regarding female genital cutting through a list experiment. Oxford Bulletin of Economics and Statistics, 80(5), 871–892. https://doi.org/10.1111/obes.12228. →
Detkova, P., Tkachenko, A., & Yakovlev, A. (2021). Gender heterogeneity of bureaucrats in attitude to corruption: Evidence from list experiment. Journal of Economic Behavior & Organization, 189, 217–233. https://doi.org/10.1016/j.jebo.2021.06.034. →
Droitcour, J., Caspar, R. A., Hubbard, M. L., Parsley, T. L., Visscher, W., & Ezzati, T. M. (1991). The item count technique as a method of indirect questioning: A review of its development and a case study application. In Measurement errors in surveys (pp. 185–210). https://doi.org/10.1002/9781118150382.ch11. a, b
Dwan, K., Gamble, C., Williamson, P. R., Kirkham, J. J., & Reporting Bias Group (2013). Systematic review of the empirical evidence of study publication bias and outcome reporting bias—an updated review. PloS One, 8(7), e66844. https://doi.org/10.1371/journal.pone.0066844. →
Ehler, I., Wolter, F., & Junkermann, J. (2021). Sensitive questions in surveys: A comprehensive meta-analysis of experimental survey studies on the performance of the item count technique. Public Opinion Quarterly, 85(1), 6–27. https://doi.org/10.1093/poq/nfab002. →
GIZ (2024). New opportunities for the Ukrainian economy—Small and medium-sized enterprises are benefiting from support to sell their products in the EU. Bonn and Eschborn. https://www.giz.de/en/downloads/giz2024-en-EU4Business.pdf →
Glynn, A. N. (2013). What can we learn with statistical truth serum? Design and analysis of the list experiment. Public Opinion Quarterly, 77(S1), 159–172. https://doi.org/10.1093/poq/nfs070. a, b, c, d
Güllü, E., Landa, V., Müller, B., Petriashvili, N., Sajons, C., Samoiliuk, M., Vincent, J., & Weiß, R. (2024). Resilience of SMEs and Public Support Measures—The case of Ukraine. Final Report. https://osf.io/qzpv3 →
Heinrich, F., & Hodess, R. (2011). Measuring corruption. In Handbook of global research and practice in corruption (pp. 18–33). https://doi.org/10.4337/9781849805032.00008. →
Heywood, P. M. (2014). Measuring corruption: perspectives, critiques and limits. In Routledge Handbook of Political Corruption (pp. 136–153). Routledge. https://doi.org/10.4324/9781315739175. →
Hinsley, A., Keane, A., St. John, F. A., Ibbett, H., & Nuno, A. (2019). Asking sensitive questions using the unmatched count technique: Applications and guidelines for conservation. Methods in Ecology and Evolution, 10(3), 308–319. https://doi.org/10.1111/2041-210x.13137. a, b, c, d
Huber-Krum, S., Hackett, K., Kaur, N., Nausheen, S., Soofi, S., Canning, D., & Shah, I. (2020). An application of the list experiment to estimate abortion prevalence in Karachi, Pakistan. International Perspectives on Sexual and Reproductive Health, 46(Supplement 1), 13–24. https://doi.org/10.1363/46e0520. →
ifm/CES (2024a). Survey on support programs in Ukraine. Wave 1, December 2023–March 2024. Availabe at: https://doi.org/10.17605/osf.io/ugs72. →
ifm/CES (2024b). Survey on support programs in Ukraine. Wave 2, October 2024. Availabe at: https://doi.org/10.17605/osf.io/ugs72. a, b
Imai, K. (2011). Multivariate regression analysis for the item count technique. Journal of the American Statistical Association, 106(494), 407–416. https://doi.org/10.1198/jasa.2011.ap10415. →
Jerke, J., Johann, D., Rauhut, H., Thomas, K., & Velicu, A. (2022). Handle with care: implementation of the list experiment and crosswise model in a large-scale survey on academic misconduct. Field Methods, 34(1), 69–81. https://doi.org/10.1177/1525822x20985629. a, b
de Kiewiet Jonge, C. P., & Nickerson, D. W. (2014). Artificial inflation or deflation? Assessing the item count technique in comparative surveys. Political Behavior, 36(3), 659–682. https://doi.org/10.1007/s11109-013-9249-x. →
Kramon, E., & Weghorst, K. (2019). (Mis) measuring sensitive attitudes with the list experiment: Solutions to list experiment breakdown in Kenya. Public Opinion Quarterly, 83(S1), 236–263. https://doi.org/10.1093/poq/nfz009. a, b, c
Krumpal, I. (2013). Determinants of social desirability bias in sensitive surveys: A literature review. Quality & Quantity, 47, 2025–2047. https://doi.org/10.1007/s11135-011-9640-9. →
Kuklinski, J. H., Cobb, M. D., & Gilens, M. (1997). Racial attitudes and the “New South”. The Journal of Politics, 59(2), 323–349. https://doi.org/10.1017/S0022381600053470. a, b
Li, J., & Van den Noortgate, W. (2022). A meta-analysis of the relative effectiveness of the item count technique compared to direct questioning. Sociological Methods & Research, 51(2), 760–799. https://doi.org/10.1177/0049124119882468. →
Moseson, H., Jayaweera, R., Huber-Krum, S., Garver, S., Norris, A., & Gerdts, C. (2021). Reducing underreporting of abortion in surveys: Results from two test applications of the list experiment method in Malawi and Senegal. PloS One, 16(3), e0247201. https://doi.org/10.1371/journal.pone.0247201. a, b, c
Munzert, S., & Selb, P. (2020). Can we directly survey adherence to non-pharmaceutical interventions? Evidence from a list experiment conducted in Germany during the early Corona pandemic. Survey Research Methods, 14(2), 205–209. https://doi.org/10.18148/srm/2020.v14i2.7759. →
Randrianantoandro, T. N., Kono, H., & Kubota, S. (2015). Knowledge and behavior in an animal disease outbreak–Evidence from the item count technique in a case of African swine fever in Madagascar. Preventive Veterinary Medicine, 118(4), 483–487. https://doi.org/10.1016/j.prevetmed.2014.12.016. →
State Statistics Service of Ukraine (2022). Salary in January 2022. https://stat.gov.ua/en/publications/salary-january-2022. Accessed 6 Dec 2024. →
Tourangeau, R., & Yan, T. (2007). Sensitive questions in surveys. Psychological Bulletin, 133, 859–883. https://doi.org/10.1037/0033-2909.133.5.859. a, b
Transparency International (2024). Corruption Perceptions Index 2023. Berlin. https://images.transparencycdn.org/images/Report_CPI2023_Eng.pdf. Accessed 6 Dec 2024. →
Traunmueller, R., Kijewski, S., & Freitag, M. (2019). The silent victims of sexual violence during war: Evidence from a list experiment in Sri Lanka. Journal of Conflict Resolution, 63(9), 2015–2042. https://doi.org/10.1177/0022002719828053. →
Treleaven, E., Pham, T. N., Nguyen, A. D., & Diamond-Smith, N. (2021). The list experiment: An approach to measuring stigmatized behaviours related to sex-selective abortion. Population Studies, 75(3), 363–380. https://doi.org/10.1080/00324728.2021.1900589. →
Tsai, C. L. (2019). Statistical analysis of the item-count technique using Stata. The Stata Journal, 19(2), 390–434. https://doi.org/10.1177/1536867X19854018. a, b, c
Wolter, F., & Laier, B. (2014). The effectiveness of the item count technique in eliciting valid answers to sensitive questions. An evaluation in the context of self-reported delinquency. Survey Research Methods, 8(3), 153–168. https://doi.org/10.18148/srm/2014.v8i3.5819. a, b, c, d