The online version of this article (https://doi.org/10.18148/srm/2026.v20i3.8545) contains supplementary material.
Survey experiments have gained substantial popularity in recent years (Treischl & Wolbring, 2022). Among these, factorial survey experiments (FSEs) are widely used to assess judgment principles and behavioral intentions, for example, on gender discrimination in hiring decisions (Bertogg et al., 2020) or perceptions of wage gaps between immigrants and natives (Semyonov et al., 2024). FSEs combine the strengths of traditional surveys, that is, large heterogeneous samples, with those of experimental designs, such as highly controlled environments, enhancing both external and internal validity (Auspurg & Hinz, 2015).
FSEs have methodological strengths, such as disguising sensitive dimensions compared to single-item questioning (Auspurg et al., 2014), and realistic questioning that encourages trade-offs, while enabling the estimation of individual effects through randomized and orthogonal design structures (Auspurg & Hinz, 2015). Further, when implemented correctly, FSEs achieve level balance across dimension levels, maximizing variance and statistical power (Auspurg & Hinz, 2015, p. 25).
However, nonresponse can threaten these advantages. In survey research, nonresponse occurs in two main ways: unit nonresponse, in which respondents do not participate in the survey at all, and item nonresponse, in which respondents answer “don’t know” or skip specific questions (Ciuk & Yost, 2019; Shamon et al., 2022). Vignette nonresponse is a specific type of item nonresponse and refers to missing evaluations of vignettes.
In standard survey questions, item nonresponse can introduce systematic bias when specific subgroups do not answer them (Rässler & Riphahn, 2006). In FSEs, item nonresponse might affect not only the answers but the entire experimental design (Ciuk & Yost, 2019). In particular, missing vignette evaluations may jeopardize level balance and orthogonality, potentially leading to dependencies between dimensions and biased estimates (Auspurg & Hinz, 2015; Wooldridge, 2010).
Although vignette nonresponse occurs relatively infrequently (Auspurg et al., 2019; Shamon et al., 2022), it can still arise under certain conditions. Often, item nonresponse is linked to strong satisficing, in which respondents reduce cognitive burden during the response process when the task is perceived as too burdensome or sensitive by quitting the entire process (Krosnick & Alwin, 1987; Shamon et al., 2022; Tourangeau, 1984). Sauer et al. (2020), for example, show that item nonresponse increases when respondents are asked to use magnitude scales rather than standard rating scales, suggesting that task complexity plays a key role.
In this paper, we present a potentially failed FSE due to item nonresponse. We report on an FSE on attitudes toward voluntary unemployment insurance for entrepreneurs in Germany, which yielded an unexpectedly high rate of item nonresponse. To explain this surprising finding, we revisited the design and implementation of the experiment to answer two central questions: 1) What design flaws or contextual factors may have contributed to the high item nonresponse rates? 2) How can researchers consider—and possibly prevent—systematic item nonresponse in factorial survey experiments? In doing so, we contribute to the relatively small body of literature on item nonresponse in factorial survey experiments, particularly by investigating the potential underlying causes of item nonresponse in the experimental design. Additionally, we contribute to the growing conversation about research transparency by sharing this failed experiment and learning from mistakes to improve methodological guidelines, especially in the realm of factorial survey experiments.
Between July 1 and July 28, 2024, we conducted a web survey targeting entrepreneurs who received a subsidy from the Federal Employment Agency to found a company in Germany between 2015 and 2017 (Zimmermann, 2024)1. The survey included a factorial survey experiment. The study population consists of 31,535 entrepreneurs drawn from the Federal Employment Agency’s administrative data. 3110 individuals completed the web survey, yielding a response rate of 10%. For our analyses, we use the survey and the administrative data of the Federal Employment Agency. Because of privacy policies, we link survey and administrative data only for respondents who consented to linking their survey responses with administrative data. 87% of individuals consented, yielding an analytical sample of 2701 participants (Supplementary Information, Table A1). We focus only on individuals who consented because socio-demographic variables, such as age and gender, are available only in administrative data. See Table A2 in the Supplementary Information for summary statistics of the sample.
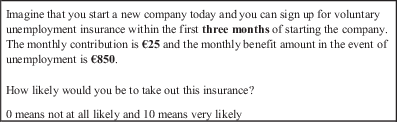
The factorial survey experiment examines the likelihood that entrepreneurs purchase voluntary unemployment insurance, which is available in Germany for the first three months after founding a company. To assess the insurance’s attractiveness, we experimentally varied three attributes: the time limit after founding in which entrepreneurs can purchase the insurance, including 3, 6, and 12 months, the monthly insurance contribution, encompassing €25, €100, and €150, and the amount of unemployment benefits, including €850, €1400, and €1950 (Fig. 1). To ensure a realistic description, these values were adapted from the Austrian voluntary insurance model (see Supplementary Information, Appendix B).
The experimental design included three dimensions with three levels each (3 × 3 × 3), resulting in a vignette universe of 27 unique vignettes. The vignettes were tested internally by researchers and university students, who deemed all combinations plausible and logical; thus, the full set of 27 vignettes was retained, resulting in a full factorial design. Three vignettes were randomly assigned to each respondent, drawn without replacement: 27 × 26 × 25 (27 unique vignettes in the first draw, 26 in the second, and 25 in the third), ensuring orthogonality and level balance.
We followed the methodological guidelines by Auspurg & Hinz (2015). Thus, several elements of our design adhere to established best practices to reduce item nonresponse. First, implementing the FSE in a web-based mode is consistent with the current gold standard for FSEs. Web mode reduces social desirability bias by eliminating the interviewer’s presence. It allows respondents to visually take in the vignettes, thereby decreasing cognitive burden and reducing the likelihood of strong satisficing in the form of item nonresponse (Auspurg & Hinz, 2015, p. 75ff). Further, distributing only three vignettes per respondent reduces fatigue effects, as this number is far below the threshold of 10 vignettes for these effects.
Where we did not follow best practices was the simple design with only three dimensions, which falls below the standard 7 ± 2 dimensions commonly recommended. This limited number of dimensions might lead to boredom or fatigue because respondents repeatedly evaluate very similar vignettes (Auspurg & Hinz, 2015, p. 18). We show individuals only three vignettes, and the results are robust for the first vignette; thus, this deviation from the guidelines provided by Auspurg & Hinz (2015) probably does not affect our study.
All these decisions were intended to achieve a high level of data quality in our FSE. However, despite our efforts, our study experienced unusually high item nonresponse in the vignette evaluations. Upon reflection, we identify some aspects of the design process that may have contributed to the emergence of item nonresponse. Most notably, we conducted an informal pretest with academic colleagues and university students but refrained from a formal pretest with members of the target population. While our internal pretests found all vignettes to be logical and comprehensible, this may not have held for the actual respondents. In particular, the Austrian model we incorporated into the study design seemed plausible to us due to the similarities between Germany and Austria (Auswärtiges Amt, 2025) and their labor market institutions (e.g., Ebner et al., 2013) but may have been sensitive, unrealistic, or confusing for our respondents.
In summary, while the majority of the experimental design follows best practices, the lack of target population-specific pretests and assumptions about the plausibility may have undermined data quality. We will further investigate the potential sources and consequences of item nonresponse through extensive data analysis in the following sections.
To answer our first research question—What design flaws or contextual factors may have contributed to the high item nonresponse rates?—we examine three potential sources of error: software and coding malfunctions, survey design, and respondent characteristics.
We first investigate whether technical issues, such as software or coding malfunctions, contributed to item nonresponse. Each respondent was randomly assigned three vignettes from the entire vignette universe. As shown in Figure A1, the levels of each surveyed dimension are distributed evenly, ensuring level balance and orthogonality by design. Further, we reviewed all data preprocessing steps and found no anomalies. Based on these checks, we did not find any evidence that software and coding malfunctions contribute to item nonresponse.
The surveyed vignettes were randomly assigned to participants (Figure A1). However, response rates differ across levels of “contribution” and “benefit” dimensions, but not across levels of the “time limit” dimension (Fig. 2). Because each vignette combines one level from each of the three dimensions, a respondent who does not answer a vignette due to a particular “contribution” or “benefit” level also does not provide information on the co-occurring “time-limit” level. Consequently, item nonresponse appears in all dimensions as a baseline level of missingness. However, only systematic differences in response rates across levels within a dimension provide evidence that this dimension causes nonresponse. This induced nonresponse by the “contribution” or “benefit” dimensions also threatens the orthogonality assumption, as it creates dependencies between the dimension levels.
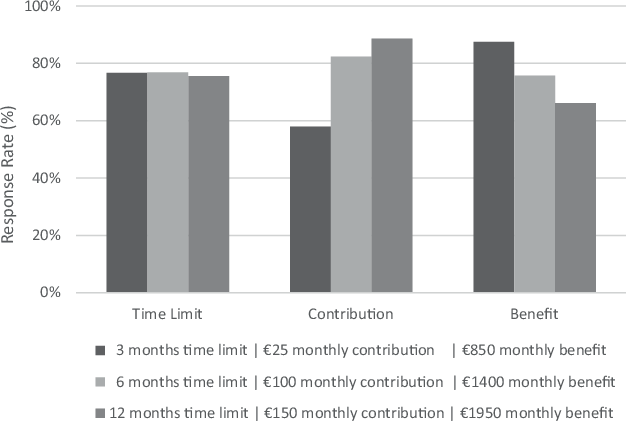
Fig. 2 Response rate by dimensions and levels.The survey levels are 3 months, 6 months, and 12 months for the time limit dimension, €25, €100, and €150 for the monthly contribution dimension, and €850, €1400, and €1950 for the benefits dimension. The number of cases is 2495 individuals and 6192 observations. Source: Own survey and own calculations (Zimmermann, F. & Hensgen S, 2026).
To investigate correlations across different dimensions, we present results for both the nonparametric Spearman rank correlation coefficient and the parametric Pearson’s correlation coefficient.
Higher contributions are positively associated with the response rates, while higher benefits are negatively associated with response rates (Supplementary Information, Table A3). The absolute sizes of the correlations range from 0.2 to 0.3, which are considered small to medium in size (Akoglu, 2018; Lovakov & Agadullina, 2021). For the time limit dimension, the response rates are evenly distributed. The correlation is not statistically significant and negligibly small, with a size of 0.001. These findings indicate that contributions, benefits, or both may be subject to systematic item nonresponse.
As the dimensions, benefits, and contributions may be potential reasons for systematic item nonresponse, we examine their combination. As before, the €25 contribution level (Fig. 3—dark gray bar) is associated with lower response rates. Additionally, the difference in response rates becomes more pronounced at higher benefit levels. When focusing on complete cases, the correlation between contribution and benefits is statistically significant when considering all levels of each dimension, albeit the correlation coefficient is below 0.1. Thus, its effect size might reflect “ambient correlational noise” (Table A4) (Weinerová et al., 2022, p. 20). When excluding the €25 contribution level, these correlations disappear (Table A5), and the distribution of response rates across benefit levels becomes more even (Figure A2). Furthermore, the correlation between contribution and benefits decreases by around 50%, from 0.056 to 0.028. These results suggest that combinations of low contributions and medium-to-high benefits are particularly affected by item nonresponse, whereas those of high contributions and low benefits are not.
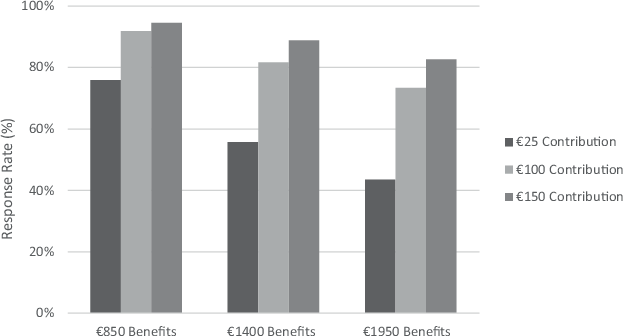
Fig. 3 Response rates of contribution levels by benefits.The number of cases is 2495 individuals and 6192 observations. Source: Own survey and own calculations (Zimmermann, F. & Hensgen S, 2026).
To further investigate the extent of item nonresponse across the vignette universe, we analyze the response frequency for each vignette from the vignette universe. First, we assess whether all 27 vignettes were answered at least 10 times to ensure sufficient statistical power. Each vignette was answered at least 125 times, ensuring sufficient statistical power. Second, we investigate the distribution of responses for each vignette. Fig. 4 shows clear differences in the response distribution, with a global peak around 225 and a local peak around 150, indicating two distinct distributions. When splitting the vignette universe into subsets with and without the €25 contribution level, we observe substantial variation between these two subsamples. While the vignette sample with the €25 contribution level has been answered around 125–225 times, the vignette sample without the €25 contribution level has been answered 215–300 times. This minimal overlap suggests that the €25 contribution level is the primary driver of item nonresponse. These findings complement the correlation analyses and show that removing the first contribution level, €25, may effectively mitigate item nonresponse.
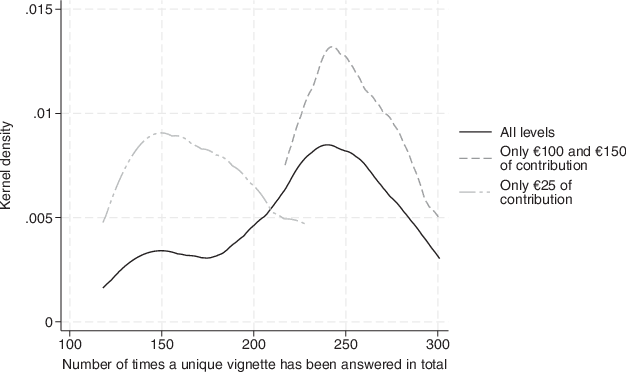
Fig. 4 Kernel density of the evaluated vignette universe by contribution level shown on vignettes.Vignettes are grouped according to contribution amount shown on the vignette irrespective of the values of the other two vignette dimensions. The x‑axis displays the number of times each unique vignette—that is, each unique combination of levels across all three dimensions—was evaluated. “All levels” represents all vignettes including €25, €100 and €150 of contributions. “Only €100 and €150 of contribution” includes all vignettes that have level 2 (€100) or level 3 (€150) of contribution and any level of the other two dimensions. “Only €25 of contribution” includes all vignettes that have level 1 (€25) of contribution and any level of the other two dimensions. The number of observations is 6192. Source: Own survey and own calculations (Zimmermann, F. & Hensgen S, 2026).
We next investigate whether item nonresponse varies systematically across respondent characteristics, specifically by gender, age, and entrepreneurship status. First, response rates are identical for men and women, at 76%. When excluding the €25 contribution level, we still find statistically significant Spearman rank correlations between dimensions for women and men, albeit their sizes are below 0.1 and thus negligible (Table A6). Among women, contributions and time limits remain statistically significantly correlated, whereas among men, contributions and benefits are statistically significantly correlated. These findings suggest some, potentially negligibly small, systematic differences in item nonresponse between women and men, albeit these correlations might also just reflect “ambient correlational noise”. Thus, we perform further analyses to test whether this potential bias affects the results.
Second, using a sample split at the median age of 51, we find that older respondents answer approximately 73% of the vignettes, while younger respondents answer 80%. When the first contribution level is excluded, we find no statistically significant correlations between any dimensions for either age group, and the correlation sizes are negligibly small, with values below 0.04 (Table A7). These results indicate that age differences should not lead to systematic item nonresponse.
Third, entrepreneurship status might influence item nonresponse, as the relevance of the insurance differs for current versus former entrepreneurs. In our sample, 77% are currently entrepreneurs (Supplementary Information, Table A2) and have a higher response rate (79%) than former entrepreneurs (69%). However, we find no statistically significant correlations among the dimensions when excluding the first level of contribution for either group (Table A8). Notably, the correlation sizes for some dimensions are 0.06, which are thus larger than the statistically significant correlations between some dimensions for men and women. However, their correlation size is still negligibly small, and might again reflect “ambient correlational noise”. Overall, we find no evidence that differences in entrepreneurship status led to systematic item nonresponse. However, we still include entrepreneurship status for further robustness checks, given the size of the correlations.
To answer our second research question—How can researchers consider—and possibly prevent—systematic item nonresponse in factorial survey experiments?—we investigate the impact of excluding certain levels or subgroups from the item nonresponse analysis to evaluate the potential impact on substantive results of the factorial survey experiment.
We begin by investigating whether the €25 contribution level affects the FSE results. To do so, we employ OLS regressions across three samples: the full sample, the €25 contribution-only sample, and the sample excluding the €25 contribution level (see the comprehensive models in the Supplementary Information Table A9). The results for the full sample (depicted by the black dots in Fig. 5) show no effect of the time limit on the probability of buying voluntary unemployment insurance. Higher contributions lower the probability of buying this insurance, while higher benefits increase it. These results remain robust even when vignettes with the €25 contribution level are excluded. Likewise, when analyzing only the €25 contribution level subsample, the results for time limits and benefits remain robust. Notably, the €1950 benefit is marginally not statistically significantly different from the €1400 benefit at the 5% level (p = 0.075) when focusing on the €25 contribution level subsample. However, there are no statistically significant differences in the coefficient sizes across the three levels. In summary, the general pattern remains unchanged, suggesting that the potentially systematic item nonresponse associated with the €25 contribution level does not substantially bias the results.
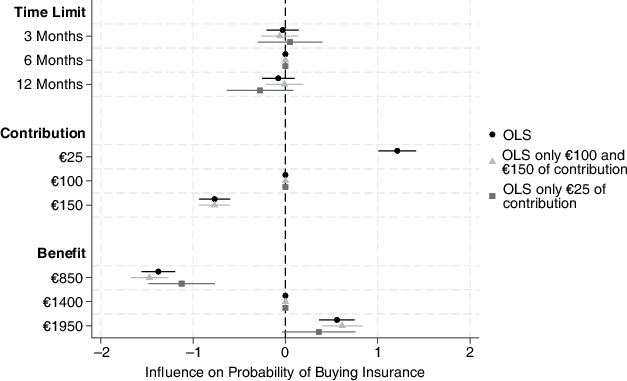
Fig. 5 Linear regression model on the probability of buying insurance.The dependent variable is the probability of buying voluntary unemployment insurance. See Table A9 the Supplementary Information for the coefficients of the variables and the number of cases. The standard errors are clustered at the individual level and the confidence intervals reported are at the 95% level (two-tailed t‑test). The number of cases is 2495 individuals and 6192 vignette evaluations for the OLS regressions, 2405 individuals and 4642 observations for the OLS only €100 and €150 of contribution, 1184 individuals and 1550 observations for the OLS only €25 of contribution. Source: Own survey and own calculations (Zimmermann, F. & Hensgen S, 2026).
To further investigate the potential effects of the €25 contribution level, we examine potential bias from exposure to implausible vignettes. Auspurg et al. (2009) found that exposure to implausible vignettes can reduce how seriously respondents take subsequent vignettes, possibly leading to biases in evaluations. We estimate separate regressions for responses collected before and after respondents saw a vignette with a €25 contribution (Figure A3). The results and coefficient sizes are similar, providing additional evidence that systematic item nonresponse does not bias the FSE outcomes.
Next, we consider whether systematic item nonresponse for women and men affects the findings (Supplementary Material, Figure A4). When estimating separate analyses for women and men, we find no statistically significant differences in coefficients by gender. Similar analyses by age group and entrepreneurship status, two groups with differences in item nonresponse (Supplementary Material, Figure A5), also yield consistent results. In summary, these subgroup analyses indicate that results do not differ across respondent characteristics, despite variation in item nonresponse across groups and potentially systematic item nonresponse in some groups.
We also employ multiple tests to investigate the robustness of our results. Thus, we repeat our main regressions (Supplementary Information, Table A9) for the full sample (Column 1), for the sample excluding the €25 contribution (Column 2), and for the sample including only the €25 contribution (Column 3). In the first test, we include gender, age, and entrepreneurship status as control variables because some of these variables showed statistically significant correlations with the dimensions, albeit with negligible effect sizes (Supplementary Material, Table A10). Second, we employ fixed-effects regressions to consider time-constant unobserved heterogeneity, such as individual preferences (Supplementary Material, Table A11). Third, we employ multilevel models to account for the nested structure of the data, as individuals answered multiple vignettes (Supplementary Material, Table A12). Fourth, we restrict the analysis to the first vignette presented to each respondent to ensure that prior vignettes do not affect response behavior (Supplementary Material, Table A13). All of these tests yield similar results. Notably, the coefficients for €1950 benefits are not statistically significant for the restricted versions of the first vignette regressions (Columns 2 and 3), potentially due to the smaller sample size, although their coefficient sizes are similar to the unrestricted regression (Column 1).
This study on voluntary unemployment insurance for entrepreneurs in Germany, which experienced an unexpectedly high rate of item nonresponse—more than 20%—, provides a learning opportunity on factorial survey experiment design and handling item nonresponse after data collection.
By examining the design process and item nonresponse patterns, we can partially answer our first research question: What design flaws or contextual factors may have contributed to the high item nonresponse rates?
The answer is multifaceted: it appears that the combination of relying on concepts from other countries—in the present study, the Austrian model of voluntary unemployment insurance—and the absence of formal pretesting within the target population led to a critical design flaw. In particular, the inclusion of the €25 contribution level, which appears to be the main driver of the item nonresponse, went unnoticed during the design stage.
In general, item nonresponse is often driven by strong satisficing, as described by cognitive response theory (Krosnick & Alwin, 1987; Tourangeau, 1984). Strong satisficing describes neglecting one or more response process steps, for example, comprehension or judgment, when they are burdensome or socially uncomfortable. In our study, burden as a source of item nonresponse (Sauer et al., 2020) seems unlikely, as our vignette design is simple, and item nonresponse occurred predominantly at the €25 contribution level. Instead, a social desirability explanation could be considered. Respondents might have felt that positively evaluating the €25 contribution level appeared greedy. However, two aspects argue against this reasoning. First, the study was conducted online, which reduces the immediate social pressure associated with interviewer-administered surveys (Berzelak & Vehovar, 2018; Sauer et al., 2020). Second, respondents evaluated the €25 contribution level positively, contradicting the idea that they were abiding by the norm. If the dimension level had increased social pressure, we would expect negative evaluations.
A more plausible explanation is that respondents perceived the €25 contribution level as implausible or illogical and, thus, refused to evaluate what they viewed as a non-realistic scenario. Implausibility in vignette studies is most often associated with low data quality, particularly with how seriously respondents take the vignettes, especially those following the implausible vignette (Auspurg et al., 2009). While we found no evidence that vignettes following implausible ones were evaluated differently, our design—three vignettes per respondent—limits our ability to robustly detect such effects. It is unusual for implausibility to lead to item nonresponse in FSEs; this has—at least to our knowledge—never been documented. In this study, plausibility appears to be the most likely reason for item nonresponse, suggesting that highly implausible scenarios can lead to strong satisficing.
Through this study, we learned important lessons regarding the design and data collection process of factorial survey experiments, thus answering our second research question—How can researchers consider—and possibly prevent—systematic item nonresponse in factorial survey experiments?
Prevention is crucial, as post hoc solutions are often limited. Several design-related considerations should be prioritized.
To manage complexity, adjusting the number of dimensions is critical. The literature proposes a range of 7 ± 2 dimensions (Auspurg & Hinz, 2015). This number should be tailored based on factors such as the presentation mode, for example, oral or visual, and the nature of the dimensions, for example, short prompts versus longer descriptions.
Regarding implausibility, there is a debate on whether excluding specific level combinations is appropriate (Auspurg et al., 2009; de la Cuesta et al., 2022; Faia, 1980; Rossi & Alves, 1980). Removing combinations undermines the orthogonality of dimensions, distorts level balance, and detracts from the vignette’s purpose of exploring reality-expanding combinations, including implausible combinations and dimension levels. Thus, removing combinations might produce problematic side effects on data and external validity (Auspurg et al., 2009; de la Cuesta et al., 2022) and, in our case, even item nonresponse. To offset the effects of removing level combinations on orthogonality and level balance, Auspurg & Hinz (2015) advise employing a D-efficiency design after removing implausible scenarios from the vignette universe. The aim is to select a subset of vignettes that provides the maximum statistical information, given the number of respondents and the number of vignettes per respondent. This approach reduces the parameter variance and ensures maximal information.
For highly sensitive content, Walzenbach (2019) suggests using a between-subject design, showing each participant only one vignette or one level of the sensitive dimension. However, when feasible, a within-subject design is preferable due to its higher statistical power.
As we have learned, the study design must be thoroughly verified. There are three ways we recommend verifying your design.
Literature Review: Consult prior vignette studies or research on the study’s topic to identify potential sensitivity issues or implausible scenarios that may need to be addressed.
Focus Groups and Cognitive Interviews: Use qualitative methods to identify potential problems in vignette comprehension, plausibility, or sensitivity, ideally within your target population (Balza et al., 2022).
Pilot Testing: Conduct a small field experiment within your target population to identify technical issues, questionnaire design flaws, and patterns of item nonresponse (Wadood et al., 2021).
While prevention strategies help mitigate data-collection issues, item nonresponse may still occur, potentially compromising the statistical efficiency of the FSE, including its dimension orthogonality and level balance. Therefore, we recommend assessing whether the remaining data are still analytically usable through the following steps:
First, identify the cause of missingness. In factorial survey experiments, missingness may arise from a set of five causes: 1) software and coding malfunctions, 2) the design of the factorial survey experiment, 3) the characteristics of the respondent, 4) the interviewer, or 5) the survey modes (Alkaya & Esin, 2005; Auspurg et al., 2019). We suggest starting with a thorough check of the software and coding to rule out malfunctions. Then, analyze patterns of missingness across vignette dimensions and level combinations, respondents, interviewers, and survey modes using descriptive statistics, for example, frequency tables or scatterplots, and correlation analyses, for example, chi-square tests or logistic regressions (Kim & Curry, 1977), to help in identifying patterns which may substantially influence results.
Afterward, we recommend assessing the statistical efficiency of the FSE with the remaining data and subsets excluding potentially problematic cases. More specifically, the level balance is examined using frequency distributions, and orthogonality is assessed through correlation matrices or variance inflation factors. Tools like D‑efficiency scores provide a quantitative measure of the experiment’s precision after excluding missing observations and problematic cases. For more details on how to implement it, see chapter three in Auspurg & Hinz (2015).
Item nonresponse is a common threat to survey data quality and can arise from various factors. Missing completely at random (MCAR), such as technical errors during data collection or processing, is generally ignorable. Missing at random (MAR) describes missingness that depends on an observed characteristic, for example, missing income among lower-educated respondents, which can be controlled for in analyses (de Leeuw et al., 2003; Little & Rubin, 2019). Not missing at random (NMAR) describes missingness that depends on unobserved characteristics, for example, missing income for respondents with very high or low incomes (Carpenter et al., 2023). Common approaches to handling missing data, such as pairwise or listwise deletion (de Leeuw et al., 2003; Huisman, 1999) and imputation (Carpenter et al., 2023; Sullivan et al., 2015; Von Hippel, 2007), generally perform poorly under NMAR and thus must be handled carefully (Sullivan et al., 2015; Von Hippel, 2007).
Item nonresponse in FSEs2 is rarely addressed when the evaluation of the vignettes, that is, the dependent variable, is concerned, and while imputation is common in survey research to handle missingness in independent variables, imputing the outcome variable may pose a risk to estimation (Carpenter et al., 2023; Ciuk & Yost, 2019). Specifically, in FSEs, the evaluation, in combination with the vignette dimensions, detects meaningful decision patterns (Auspurg & Hinz, 2015). If evaluations are systematically missing due to a respondent’s attitudes, cognitive burden, or discomfort with specific vignettes or vignette dimensions, which can only be assumed and not tested empirically (NMAR), then imputation based solely on observed data may fail to uncover the true underlying judgment principles. Therefore, imputed values may attenuate actual differences, distort estimates, and lead to misleading inferences (Ciuk & Yost, 2019). Therefore, we believe that imputation is not the ideal approach to address missingness in the outcome variable for FSEs.
We suggest listwise or pairwise deletion if MCAR holds and the statistical efficiency of the FSE remains acceptable, for example, due to software malfunctions (de Leeuw et al., 2003; Huisman, 1999). For MAR data, we recommend including variables that explain missingness as covariates and performing additional sensitivity analyses to assess robustness to missingness (de Leeuw et al., 2003). However, it is important to note that this approach assumes no unobserved confounders influence the missingness.
NMAR, however, requires strong assumptions to model the missingness. For example, using proxy variables to control for the unobserved characteristic driving the missingness may be possible (Andridge & Little, 2020), but could still lead to distorted estimates. Additional sensitivity analyses or the collection of auxiliary data, such as interviewer assessments or qualitative post-interviews, may help address the strong assumptions (de Leeuw et al., 2003), although these methods may be resource-intensive.
Regardless of the approach, transparent reporting on the pattern of missing data, on statistical considerations, and on the effect size of the correlation is crucial—including recognizing when the nature of the missingness permits reliable estimation. For our study, for example, we find a statistically significant difference, but the effect size is negligibly small. For very small effect sizes, NMAR might not pose a substantial problem, even when correlations are statistically significant, because small, statistically significant correlations below 0.1 might just reflect ambient correlational noise (Weinerová et al., 2022). Thus, we advise researchers to consider both the statistical significance and effect sizes.
In conclusion, the unexpectedly high item nonresponse in our factorial survey experiment on the likelihood of entrepreneurs purchasing voluntary unemployment insurance threatened the criteria of FSEs: level balance and orthogonality. Thus, technically speaking, the experiment “failed”. However, this “failed” survey experiment creates a learning opportunity for designing and running survey experiments in general and contributes to transparent research practices. Most notably, the study highlights that, next to affecting data validity, implausible dimension levels and level combinations can result in item nonresponse. While earlier studies have discussed realism and plausibility in vignette design (e.g., Auspurg et al., 2009), they have rarely linked implausibility directly to item-level missing data patterns.
The study also highlights the difficulty of adapting policy scenarios from other countries, even when countries are culturally and linguistically similar (Auswärtiges Amt, 2025). In our case, German entrepreneurs may have found the Austrian policy unrealistic, especially the combination of low contributions and high benefits, leading to systematic item nonresponse. This finding highlights the importance of accounting for contextual knowledge, which ties to the next aspect: design diagnostics. To mitigate the risk of data quality issues, particularly regarding systematic item nonresponse, pre-data-collection design diagnostics, such as cognitive interviews or pilot testing with the target population, are essential, regardless of seemingly plausible designs and internal pretests.
This study has shown that even seemingly well-prepared FSE designs may result in item nonresponse, underscoring the need for post-hoc analyses. Moreover, this case study highlights the need for methodological FSE research on item nonresponse. The field has primarily focused on experimental designs and estimation strategies but has mostly overlooked the specific implications of item nonresponse for data quality and statistical efficiency in factorial survey experiments (cf., Auspurg et al., 2019; Shamon et al., 2022).
Future research should explore how existing techniques for handling item nonresponse in the dependent variable when missing not at random might be adapted to the unique structure of FSE. Ultimately, this study underlines the dual value of failure. It presents the possibility for methodological reflection and movement toward more robust survey experiment practices.
Akoglu, H. (2018). User’s guide to correlation coefficients. Turkish Journal of Emergency Medicine, 18(3), 91–93. https://doi.org/10.1016/j.tjem.2018.08.001 →
Alkaya, A., & Esin, A. (2005). Item nonresponse reasons and effects. Gazi University Journal of Science, 18(4), 577–589. →
Andridge, R. R., & Little, R. J. A. (2020). Proxy pattern-mixture analysis for a binary variable subject to nonresponse. Journal of Official Statistics, 36(3), 703–728. https://doi.org/10.2478/jos-2020-0035 →
Auspurg, K., & Hinz, T. (2015). Factorial survey experiments. SAGE Publications, Inc. https://doi.org/10.4135/9781483398075 a, b, c, d, e, f, g, h, i, j, k, l
Auspurg, K., Hinz, T., & Liebig, S. (2009). Komplexität von Vignetten, Lerneffekte und Plausibilität im Faktoriellen Survey. Methoden, Daten, Analysen, 3(1), 59–96. a, b, c, d, e
Auspurg, K., Hinz, T., Liebig, S., & Sauer, C. (2015). The factorial survey as a method for measuring sensitive issues. In U. Engel, B. Jann, P. Lynn, A. Scherpenzeel, & P. Sturgis (Eds.), Improving survey methods: Lessons from recent research (pp. 137–149). Routledge/Taylor & Francis Group. →
Auspurg, K., Hinz, T., & Walzenbach, S. (2019). Are factorial survey experiments prone to survey mode effects? In P. Lavrakas, M. Traugott, C. Kennedy, A. Holbrook, E. De Leeuw & B. West (Eds.), Experimental methods in survey research (1st edn., pp. 371–392). Wiley. https://doi.org/10.1002/9781119083771.ch19 a, b, c
Auswärtiges Amt (2025). Germany and Austria: Bilateral relations. Online post. https://www.auswaertiges-amt.de/en/aussenpolitik/laenderinformationen/oesterreich-node/austria-227912 a, b
Balza, J. S., Cusatis, R., McDonnell, S. M., Basir, M. A., & Flynn, K. E. (2022). Effective questionnaire design: How to use cognitive interviews to refine questionnaire items. Journal of Neonatal-Perinatal Medicine, 15(2), 345–349. https://doi.org/10.3233/NPM-210848 →
Bertogg, A., Imdorf, C., Hyggen, C., Parsanoglou, D., & Stoilova, R. (2020). Gender discrimination in the hiring of skilled professionals in two male-dominated occupational fields: a factorial survey experiment with real-world vacancies and recruiters in four european countries. KZfSS Kölner Zeitschrift Für Soziologie Und Sozialpsychologie, 72(S1), 261–289. https://doi.org/10.1007/s11577-020-00671-6 →
Berzelak, N., & Vehovar, V. (2018). Mode effects on socially desirable responding in web surveys compared to face-to-face and telephone surveys. Metodološki Zvezki/Advances in Methodology and Statistics, 15(2), 21–43. →
Carpenter, J. R., Kenward, M. G., Bartlett, J. W., Morris, T. P., Quartagno, M., & Wood, A. M. (2023). Multiple imputation and its application 2e (1st edn.). Wiley. https://doi.org/10.1002/9781119756118 a, b, c, d
Ciuk, D. J., & Yost, B. A. (2019). Conflicting cues: item nonresponse and experimental mortality. In P. Lavrakas, M. Traugott, C. Kennedy, A. Holbrook, E. De Leeuw & B. West (Eds.), Experimental Methods in Survey Research (1st edn., pp. 167–180). Wiley. https://doi.org/10.1002/9781119083771.ch9 a, b, c, d
de la Cuesta, B., Egami, N. and Imai, K. (2022) Improving the external validity of conjoint analysis: the essential role of profile distribution, political analysis, 30(1), 19–45. https://doi.org/10.1017/pan.2020.40 →
Ebner, C., Graf, L., & Nikolai, R. (2013). New institutional linkages between dual vocational training and higher education: a comparative analysis of germany, austria and switzerland. In Integration and inequality in educational institutions (pp. 281–298). Dordrecht: Springer Netherlands. https://doi.org/10.1007/978-94-007-6119-3_14 →
Faia, M. A. (1980). The vagaries of the vignette world: A comment on Alves and Rossi. American Journal of Sociology, 85(4), 951–954. →
Huisman, M. (1999). Item nonresponse: Occurrence, causes, and imputation of missing answers to test items. Leiden: Dswo Press. https://www.researchgate.net/profile/Mark-Huisman-2/publication/268312247_Item_nonresponse_occurrence_causes_and_imputation_of_missing_answers_to_test_items/links/593ea5cf0f7e9bf167c044bd/Item-nonresponse-occurrence-causes-and-imputation-of-missing-answers-to-test-items.pdf a, b
Kim, J. O., & Curry, J. (1977). The treatment of missing data in multivariate analysis. Sociological Methods & Research, 6(2), 215–240. →
Krosnick, J. A., & Alwin, D. F. (1987). An evaluation of a cognitive theory of response-order effects in survey measurement. Public Opinion Quarterly, 51(2), 201–219. https://doi.org/10.1086/269029 a, b
de Leeuw, E. D., Hox, J., & Huisman, M. (2003). Prevention and treatment of item nonresponse. Journal of Official Statistics, 19(2), 153–176. a, b, c, d, e
Little, R. J., & Rubin, D. B. (2019). Statistical analysis with missing data. John Wiley & Sons. →
Lovakov, A., & Agadullina, E. R. (2021). Empirically derived guidelines for effect size interpretation in social psychology. European Journal of Social Psychology, 51(3), 485–504. https://doi.org/10.1002/ejsp.2752 →
Rässler, S., & Riphahn, R. T. (2006). Survey item nonresponse and its treatment. Allgemeines Statistisches Archiv, 90(1), 217–232. https://doi.org/10.1007/s10182-006-0231-3 →
Rossi, P. H., & Alves, W. M. (1980). Rejoinder to Faia. American Journal of Sociology, 85(4), 954–955. →
Sauer, C., Auspurg, K., & Hinz, T. (2020). Designing multi-factorial survey experiments: effects of presentation style (text or table), answering scales, and vignette order. Methods, Data, Analyses, 14(2), 195–214. https://doi.org/10.12758/MDA.2020.06 a, b, c
Semyonov, M., Gorodzeisky, A., Raijman, R., & Hinz, T. (2024). Endorsement of wage discrimination against immigrants: Results from a multifactorial survey experiment in Israeli society. Research in Social Stratification and Mobility, 89, 100891. https://doi.org/10.1016/j.rssm.2024.100891 →
Shamon, H., Dülmer, H., & Giza, A. (2022). The factorial survey: the impact of the presentation format of vignettes on answer behavior and processing time. Sociological Methods & Research, 51(1), 396–438. https://doi.org/10.1177/0049124119852382 a, b, c, d, e
Sullivan, T. R., Salter, A. B., Ryan, P., & Lee, K. J. (2015). Bias and precision of the “multiple imputation, then deletion” method for dealing with missing outcome data. American Journal of Epidemiology, 182(6), 528–534. https://doi.org/10.1093/aje/kwv100 a, b
Tourangeau R. (1984). Cognitive sciences and survey methods. In .T. Jabine, M. Straf, J. Tanur, R. Tourangeau (Eds.), Cognitive aspects of survey methodology: building a bridge between disciplines. Washington, DC: Natl. Acad. Press, 73–100. https://www.researchgate.net/publication/245684668_Cognitive_Sciences_and_survey_methods a, b
Treischl, E., & Wolbring, T. (2022). The past, present and future of factorial survey experiments: a review for the social sciences. Methods, Data, Analyses, 16(2), 141–170. https://doi.org/10.12758/MDA.2021.07 →
Von Hippel, P. T. (2007). Regression with missing ys: an improved strategy for analyzing multiply imputed data. Sociological Methodology, 37(1), 83–117. https://doi.org/10.1111/j.1467-9531.2007.00180.x a, b
Wadood, F., Akbar, F., & Ullah, I. (2021). The importance and essential steps of pilot testing in management studies: a quantitative survey results. Journal of Contemporary issues in Business and Government 27(5). https://api.semanticscholar.org/CorpusID:248394942 →
Walzenbach, S. (2019). Hiding sensitive topics by design? an experiment on the reduction of social desirability bias in factorial surveys. Survey Research Methods, 13(1), 103–121. https://doi.org/10.18148/SRM/2019.V1I1.7243 →
Weinerová, J., Szűcs, D., & Ioannidis, J. P. A. (2022). Published correlational effect sizes in social and developmental psychology. Royal Society Open Science, 9(12), 220311. https://doi.org/10.1098/rsos.220311 a, b
Wooldridge, J. M. (2010). Econometric analysis of cross section and panel data. MIT press. →
Zimmermann, F. (2024). Factorial survey on voluntary insurance for entrepreneurs Dataset. →
Zimmermann, F. & Hensgen S. (2026). Program code—oops, they didn’t answer again! Dealing with systematic item nonresponse in a factorial survey experiment. https://osf.io/4a23w/overview a, b, c, d