The online version of this article (https://doi.org/10.18148/srm/2026.v20i3.8543) contains supplementary material.
Plain language (PL) is a writing style that encompasses the wording, structure, and visual design of written information and aims to promote comprehensibility and inclusion through clear, concise, and easily understandable language (Hansen-Schirra and Maaß 2020). In previous experimental studies (Bauer et al. 2025; Kunz et al. 2026), we used web survey questions translated into PL, aiming to increase their comprehensibility and thereby improve the quality of respondents’ answers. However, these studies produced inconsistent and sometimes contradictory results, providing no clear evidence that PL improved comprehensibility or response quality.
Survey research often yields inconclusive or even contradictory results, reflecting the inherent complexity of studying human behavior and perceptions. When designing questionnaires and analyzing response behavior, such outcomes can stem from weaknesses in the research design and implementation, including participant selection, treatment design, and measurement choice (e.g., DeCastellarnau 2018; Roberts et al. 2019). Respondents’ characteristics (e.g., demographics, survey experience, and engagement) determine how they process and answer survey questions, and respondents who lack cognitive ability or motivation are more likely to provide incomplete or inaccurate responses (e.g., Krosnick 1991). The design of treatments and experimental stimuli, including the wording, structure, and context of survey questions, significantly affects respondents’ interpretations and responses. The absence of a comparison group, inadequate operationalization, or imprecise translations may distort the intended meaning, and thereby produce inconclusive or misleading findings. Finally, the choice and operationalization of measures (i.e., dependent variables) must align with the research objectives, and these measures must be sufficiently sensitive and specific to detect subtle effects; otherwise, findings may be incomplete or biased.
Against this backdrop, using PL in web surveys as an example, this paper illustrates how supplementary analyses can help clarify unclear or contradictory results and provide insights that help avoid future failures and strengthen the methodological rigor of survey research. For this purpose, we draw on an experimental study using PL in a web survey (Study I). As the findings of that study diverged from theoretical expectations and prior empirical evidence, we conducted a follow-up study (Study II), which provided further insights into whether these discrepancies were substantive or caused by methodological choices regarding participant selection, experimental stimuli—including the wording and translation of survey questions—or measures.
The paper proceeds by presenting Study I and Study II and concludes with practical recommendations for improving survey research by examining inconclusive findings more deeply and transforming them into productive learning opportunities.
PL is characterized by clear, concise, and easily understandable language promoting comprehensibility and inclusion. In terms of its complexity, comprehensibility, and acceptability, it is situated between easy language (EL) and standard language (SL). PL is suitable for a broad audience, including individuals with limited literacy skills (e.g., persons with a low command of the national language or infrequent readers) and those unfamiliar with a topic. By contrast, EL is targeted primarily at people with cognitive disabilities or learning difficulties. PL simplifies language without altering its content, thereby reducing cognitive effort compared with SL while maintaining a higher level of acceptance than EL, which may be perceived as overly simplistic or stigmatizing for a broad audience (Hansen-Schirra and Maaß 2020). PL guidelines for the wording, sentence structure, and visual layout of written text recommend, for example, using simple words, active voice, and present tense and keeping sentences short (10–15 words) and focused on one idea while avoiding unnecessary detail. A clean visual layout (bulleted lists, new lines for each sentence) can further enhance comprehensibility (Hansen-Schirra and Maaß 2020; Leskelä et al. 2022). The following example from Bauer et al. (2025) illustrates the difference between SL and PL in survey practice. A question used in FReDA – The German Family Demography Panel Study, a self-administered, mixed-mode probability panel (Hank et al. 2025), asks: “Do you think your financial situation will improve, worsen, or remain about the same in three years or over the next three years?” In PL, this can be simplified to: “Will you have more or less money available over the next three years?” This example shows that, although survey questions should generally be clear, SL tends to rely on more formal and structurally complex wording, whereas PL uses simpler and more direct phrasing.
Prior research on questionnaire design has shown that easy-to-understand survey questions are more likely to elicit high-quality responses (Holbrook et al. 2006; Lenzner 2012; Lenzner et al. 2010), as respondents can process them with less cognitive burden and are therefore less prone to satisficing behaviors, such as skipping questions, overusing specific response options, or speeding through the questionnaire (Krosnick 1991). Building on this insight, PL can be one way to enhance the comprehensibility of survey questions, thereby improving response quality. PL is considered to facilitate cognitive processing for all respondents, ensuring high-quality responses without undue effort. For respondents with low literacy skills, PL can help to avoid comprehension issues, while for those with medium or high literacy skills, it reduces cognitive demands, thereby increasing the quality of responses overall (Bauer et al. 2025; Kunz et al. 2026). Especially in web surveys, where respondents must read and understand the survey questions without the assistance of an interviewer, respondents may benefit from survey questions designed following the principles of PL to reduce their cognitive effort and the difficulties involved in processing the questions. However, our previous studies on using PL instead of SL in web surveys (Bauer et al. 2025; Kunz et al. 2026) yielded inconclusive findings regarding commonly used indicators of response quality, such as item nonresponse, extreme and midpoint responding, response differentiation, and response times (Roberts et al. 2019). In the first study (Bauer et al. 2025), respondents took longer to answer questions in PL than in SL, whereas other indicators, such as item nonresponse and response differentiation, were unaffected. By contrast, in the second study (Kunz et al. 2026), we found that PL shortened response times, increased response differentiation, and reduced midpoint responding.
These inconclusive and partly contradictory findings from our prior research led us to conduct Study I, in which we aimed to investigate (a) whether PL improves response quality in web surveys; and (b) if not, whether this is due to a lack of improvement in the comprehensibility of the survey questions. To ensure comparability, we used the same response quality indicators as in our previous studies. We assumed that PL would enable respondents to process survey questions more efficiently and to express their opinions more distinctly, which should be reflected in shorter response times, reduced midpoint responding, and potentially more frequent use of extreme response options. To assess the comprehensibility of the survey questions, we used web probing, expecting that respondents would rate questions in PL as more comprehensible than those in SL. This method is well-suited for assessing the comprehensibility of survey questions because it measures respondents’ understanding of questions directly (Beatty & Willis 2007; Neuert et al. 2023) rather than inferring it from behavioral indicators such as response times or item nonresponse (e.g., Lenzner et al. 2010; Yan & Tourangeau 2008). Web probing can be implemented with large and diverse samples at relatively low cost, enabling researchers to gather systematic evidence under actual survey conditions. In Study I, we used closed-ended comprehensibility probes (Neuert et al. 2025), asking respondents how understandable they found the words and terms, sentence structure, and content of each survey question.
We conducted a web survey in Germany in December 2022 using a nonprobability online access panel of individuals who had previously registered via a double-opt-in procedure to participate in surveys of varying topics and lengths. Participants typically receive conditional incentives in the form of redeemable points for completing a survey. For this study, we used quotas for gender, age, and educational attainment to approximate the distribution of the German general population according to the 2021 Microcensus. Of the 5661 panelists invited, 4353 began the survey, 907 were screened out due to age restrictions (18–69 years) or full quotas, and 3256 completed the survey, yielding a participation rate of 95% (AAPOR 2023) and a break-off rate of 6% (n = 190). Of the 3256 respondents who completed the survey, 49% were female, the average age was 46, and 41% had a higher education entrance qualification.
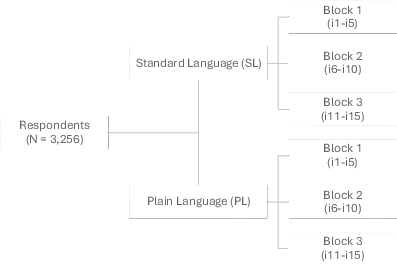
In a between-subjects design, respondents were randomly assigned to one of two language versions (SL or PL) and one of three item blocks derived from 15 items (see Fig. 1). To reduce respondent burden and mitigate habituation or wear-out effects from repeated exposure to the probing questions, the items were divided into three blocks of five items each, with each respondent answering and evaluating only one block. To minimize order effects, items within each block were presented in random order. To ensure that items and response options were presented nearly identically in SL and PL, regardless of device, screen size, or language version, items were presented individually, one per page, in an item-by-item format (see Figure A1 in the Supplementary material).
The SL items were translated into PL by experts at Lebenshilfe Bremen e. V., an organization specialized in professional PL translation. We adopted the translations without further modification. Before fielding the study, we classified the differences between PL and SL items as either moderate or large. This classification was based on our subjective assessment of the extent of changes introduced during translation. We defined moderate changes as adjustments in wording only, without altering sentence structure or visual design. We considered large changes to involve modifications of wording, sentence structure, and/or visual design. Three items within each item block included large changes, while two featured only moderate changes. All items were answered on a fully labeled 5‑point scale (see Table A1 in the Supplementary material for the German SL and PL items and response options and the English translations).
We assessed response quality using four indicators of satisficing behavior, which reflect strategies respondents adopt to reduce cognitive effort and complete questionnaires with minimal engagement: item nonresponse, extreme responding, midpoint responding, and response times (Krosnick 1991; Roberts et al. 2019). Prior research has shown that complex questions lacking clarity, containing awkward wording, or posing comprehension difficulties are more likely to result in item nonresponse (Beatty and Herrmann 2002; Krosnick 2002; Shoemaker et al. 2002). Respondents are more likely to select the middle response option on questions with lower perceived clarity (Kulas and Stachowski 2009; Velez and Ashworth 2007), whereas they are more likely to choose extreme response options when they perceive the questions to be more meaningful (Gibbons et al. 1999). Furthermore, studies have shown that poorly worded questions containing features such as low-frequency words or complex syntax take longer to answer (Lenzner et al. 2010).
We calculated item nonresponse as the proportion of respondents who did not answer a particular item (respondents could skip items without being forced to answer). Extreme and midpoint responding, often negatively correlated, reflect tendencies to choose specific response options regardless of item content. Extreme responding refers to selecting the most extreme options (e.g., 1 or 5 on a 5-point scale), while midpoint responding involves overusing the middle option (e.g., 3 on a 5-point scale). We measured extreme and midpoint responding based on the proportion of respondents choosing these options. Response times reflect the cumulative time spent on a web page or, in the case of an item-by-item format, on each item (including repeated page visits when respondents used the back button). We derived response times from server-side timestamps. When calculating mean response times (in seconds), we excluded respondents who did not complete the survey in one sitting and respondents whose response times were more than two standard deviations above the group mean.
To assess question comprehensibility, we used a closed-ended probe comprising three items measuring the comprehensibility of the words and terms, sentence structure, and content of the survey question, respectively (see Figure A2 in the Supplementary material). After each survey question, respondents were presented with this multi-item probe on a single web page and asked: (a) “How understandable did you find the words and terms in the question?”; (b) “How understandable did you find the sentence structure of the question?”; and (c) “How understandable did you find the content of the question?” Responses were given on a 7-point scale ranging from 1 (not at all understandable) to 7 (completely understandable). We calculated a comprehensibility index as the mean of the three individual ratings.
Table 1 summarizes item means and response quality results for items in SL and PL in Study I. For most items (12 out of 15), we found statistically significant mean differences between the two language versions, with PL mostly yielding lower means than SL. Item nonresponse was very low and did not differ between PL and SL, but statistically significant differences emerged in extreme responding, midpoint responding, and response times. SL yielded higher proportions of extreme responses for seven of the 15 items, whereas PL did so for two items. By contrast, for 12 items, PL consistently showed higher proportions of midpoint responses. Additionally, response times differed significantly for 10 items, with PL items taking longer to answer than SL items. All statistically significant differences in extreme responding, midpoint responding, and response times ran counter to our expectations.
Table 1 Response Quality for Items in Standard Language (SL) and Plain Language (PL) in Study I and Comprehensibility of SL and PL Items in Study I and Study II
Items | i1 | i2 | i3 | i4 | i5 | i6 | i7 | i8 | i9 | i10 | i11 | i12 | i13 | i14 | i15 | |
SL–PL differences * | M | M | L | L | L | M | M | L | L | L | M | M | L | L | L | |
* M moderate changes in wording but not in sentence structure or design; L large changes in wording and/or sentence structure and design. The categorization into moderate and large changes is based on the authors’ subjective assessments. Superscripts indicate statistically significant differences (p ≤ 0.05) between SL and PL: a expected direction; b opposite-to-expected direction; c no expected direction. | ||||||||||||||||
Study I | ||||||||||||||||
Item means (mean) | SL | 4.6 | 3.7c | 4.2c | 2.5c | 3.1c | 2.7c | 3.7c | 3.2c | 3.7c | 2.8 | 4.1 | 3.6c | 2.8c | 2.5c | 3.1c |
PL | 4.6 | 2.8c | 4.0c | 3.0c | 2.7c | 2.5c | 2.7c | 2.7c | 3.2c | 2.8 | 4.0 | 2.9c | 2.6c | 2.6c | 2.4c | |
Item nonresponse (%) | SL | 0.9 | 0.2 | 0.2 | 0.2 | 0.2 | 0.2 | 0.2 | 0.2 | 0.3 | 0.3 | 0.2 | 0.2 | 0.2 | 0.0 | 0.2 |
PL | 0.4 | 0.0 | 0.2 | 0.4 | 0.0 | 0.0 | 0.2 | 0.2 | 0.7 | 0.2 | 0.4 | 0.6 | 0.6 | 0.8 | 0.4 | |
Extreme responding (%) | SL | 77.1 | 26.8b | 41.0b | 27.3b | 18.2 | 29.9a | 21.0 | 24.4 | 26.6b | 32.3b | 64.3b | 24.3 | 26.2b | 24.6 | 25.3a |
PL | 76.8 | 19.5b | 29.7b | 15.1b | 20.7 | 35.3a | 17.9 | 27.5 | 19.7b | 25.5b | 57.8b | 21.6 | 19.9b | 20.9 | 32.2a | |
Midpoint responding (%) | SL | 7.0 | 27.5b | 13.8b | 27.5b | 30.6b | 27.0 | 23.4b | 30.5 | 26.8b | 20.4b | 11.2b | 25.9b | 36.5b | 22.5b | 23.1b |
PL | 8.9 | 48.2b | 23.5b | 44.8b | 39.8b | 31.4 | 51.4b | 33.5 | 40.1b | 32.9b | 14.7b | 48.4b | 42.3b | 34.9b | 36.9b | |
Response times (mean) | SL | 17.7b | 20.9b | 20.8b | 22.1 | 22.5b | 21.4 | 19.9b | 22.5b | 21.2b | 25.7 | 19.4b | 21.5b | 23.7b | 22.3 | 26.3 |
PL | 20.5b | 27.1b | 25.0b | 21.5 | 26.7b | 22.5 | 24.6b | 27.8b | 25.9b | 26.5 | 21.5b | 24.8b | 26.2b | 23.3 | 49.3 | |
Comprehensibility (mean) | SL | 6.4 | 6.3 | 6.2b | 6.0 | 5.8a | 6.2 | 6.3b | 5.6 | 6.0 | 5.9 | 6.5 | 6.4b | 5.4 | 6.1 | 6.2 |
PL | 6.5 | 6.2 | 6.0b | 6.1 | 6.2a | 6.2 | 6.1b | 5.5 | 5.8 | 5.9 | 6.4 | 6.2b | 5.5 | 6.0 | 6.1 | |
Study II | ||||||||||||||||
Comprehensibility (mean) | SL | 6.1 | 5.4 | 5.6b | 4.5a | 4.8 | 5.7 | 6.3 | 4.5 | 5.4 | 3.9a | 6.3 | 5.8 | 4.7 | 4.9 | 4.2 |
PL | 6.4 | 5.9 | 4.4b | 6.1a | 6.0 | 6.1 | 6.3 | 5.0 | 5.7 | 5.3a | 6.1 | 5.8 | 4.4 | 5.2 | 5.5 | |
Overall, based on the comprehensibility index, we found very high ratings across the three aspects of question comprehensibility—words and terms, sentence structure, and content—with almost identical scores for most items (11 out of 15) between PL and SL (see Table 1). Three items (i3, i7, i12) showed slightly but statistically significantly higher comprehensibility ratings in SL than in PL, whereas only one item (i5) showed the expected pattern, with a slightly but statistically significantly higher comprehensibility rating when presented in PL rather than SL. Ratings for the three aspects showed similar patterns (see Table A2 in the Supplementary material).
In Study I, we assumed that PL would improve the comprehensibility of survey questions, thereby reducing the effort and difficulty of answering them and ultimately enhancing response quality. However, contrary to theoretical expectations and previous findings, PL appeared to reduce rather than improve response quality, which was reflected in particular by consistently longer response times and more midpoint responding. Moreover, the multi-item probe assessing question comprehensibility in terms of words and terms, sentence structure, and content revealed very high ratings for both PL and SL, with no systematic differences between the two language versions.
Several explanations may account for this lack of differences in comprehensibility: The two language versions may be equally easy to comprehend; respondents may not have reliably detected or reported subtle differences in comprehensibility; or the multi-item probe may lack the sensitivity to capture such differences effectively. Furthermore, statistically significant differences in response means between PL and SL items raise concerns that the content of the two language versions may not be entirely comparable. Study II was designed to examine these possible explanations more systematically and to clarify whether PL can in fact improve comprehensibility and response quality.
The aim of Study II was to systematically assess whether the lack of differences in comprehensibility between SL and PL items in Study I was due to (1) the selection of participants, (2) the design of the experimental stimuli, or (3) the choice of measures.
Regarding participant selection, when assessing question comprehensibility in Study I, we relied on self-reports from respondents, who may have been unaware of comprehension difficulties—a phenomenon known as “silent misunderstandings” (Behr et al. 2017)—or unwilling to admit them due to social desirability bias, that is, “the tendency to portray oneself as a ‘good respondent’” (Moy and Murphy 2016, p. 19). This would mean that respondents may have been unable or unwilling to reliably distinguish between different levels of comprehensibility using probing questions.
Regarding the second factor, the design of the experimental stimuli, we used PL translations that had not been optimized or pretested for the specific target group or survey context, potentially leading to changes that respondents did not perceive as improvements. As a result, the comprehensibility of the PL and SL items may not have differed enough for respondents to perceive differences.
Regarding the third factor, the choice of comprehensibility measure, we relied on a multi-item probe that may not have been sensitive enough to detect subtle differences in comprehensibility between PL and SL. Consequently, the probing questions may have been unsuitable for detecting comprehensibility differences between language versions, and other measures may be required.
To address these potential limitations, we kept the experimental stimuli constant in Study II (using the same PL and SL items as in Study I), while varying the selection of participants and supplementing the measurement approach. This design enabled us to test whether the inconclusive findings in Study I reflected genuine equivalence in terms of comprehensibility between the PL and SL items or methodological limitations of that initial study.
In Study II, we relied on expert reviews of the comprehensibility of the survey questions by survey experts. Expert reviews are typically carried out by subject matter experts with extensive knowledge of the content, target audience, and intended use of a text (Schriver 1989). In survey research, they are a commonly used approach for evaluating survey questions during the pretest phase to identify and address potential problems with the questionnaire. Unlike respondents, survey experts are trained to identify potential problems in questionnaires and can provide differentiated assessments of the comprehensibility of questions (Olson 2010). To examine whether survey experts, who are trained and experienced in evaluating survey questions, provide more differentiated comprehensibility ratings than respondents, we asked them to rate comprehensibility using the same multi-item probe as in Study I. In addition, we asked them to directly compare the comprehensibility of PL and SL items to assess whether another measure would be better suited to detecting differences in comprehensibility. We also asked them to evaluate the comparability of the PL and SL items. This allowed us to consider the possible explanation that similar comprehensibility ratings, despite differences in item means and response quality indicators, might simply reflect the fact that the two language versions measure different underlying constructs.
We conducted a web survey with 27 survey experts in August/September 2024. We defined survey experts as individuals with several years of professional experience in survey methodology and questionnaire design. We recruited the experts through our institutional contacts at GESIS – Leibniz Institute for the Social Sciences using purposive sampling and invited them via email to participate in the study. Our goal was to assemble a group of experts that reflected the perspectives of experienced survey researchers who are regularly involved in developing and evaluating questionnaires. All of the invited experts participated in the study. Of the 27 experts, 18 were female, and nine were male. The average time to complete the questionnaire was 14 min. Participation was voluntary, and no financial incentives were offered.
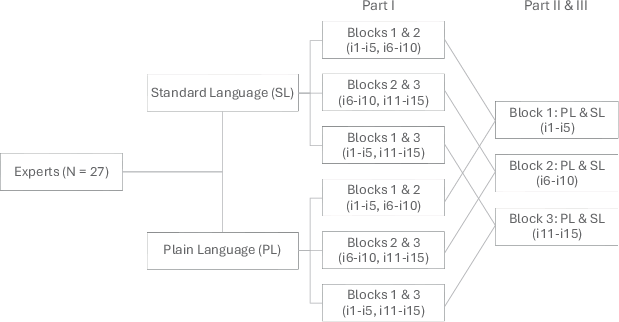
At the outset, the experts were informed about the purpose of the survey, namely, to evaluate the comprehensibility of questions in social science surveys. We used the same set of experimental questions as in Study I, consisting of 15 items in SL and PL. The survey comprised three parts (see Fig. 2), incorporating two distinct measures of comprehensibility (Parts I and III) and one measure of comparability (Part II).
In Part I, experts were randomly assigned to one of the two language versions (SL or PL). To reduce habituation or wear-out effects, they evaluated the comprehensibility of 10 of the 15 items. Items were presented individually—one per page—and in random order. Comprehensibility was assessed using the same multi-item probe as in Study I (see Figure A2 in the Supplementary material)).
In Part II, experts rated the comparability of five item pairs, each consisting of one item from Part I and its equivalent in the other language version. Specifically, they were asked to rate on an endpoint-labeled 7‑point scale ranging from 1 (not at all) to 7 (completely) the extent to which each pair measured the same underlying construct (see Figure A4 in the Supplementary material).
In Part III, the same five item pairs were presented again, and experts judged their relative comprehensibility by indicating which version (SL or PL) they considered more understandable (see Figure A3 in the Supplementary material).
In Study II, Part I, overall comprehensibility ratings were very high for both language versions (see Table 1). For 12 of the 15 items, no significant differences emerged between SL and PL. Only three items showed significant differences, with two in favor of PL (i4 and i10) and one in favor of SL (i3). Comprehensibility ratings for the three aspects of question comprehensibility (words and terms, sentence structure, content) showed similar patterns (see Table A2 in the Supplementary material).
In Part III, experts were asked to assess the comprehensibility of item pairs in SL and PL by indicating which language version they found more comprehensible. Again, no consistent overall advantage of either language version emerged (see Fig. 3). For four items (i2, i4, i10, i14), most experts rated the PL version as more comprehensible, while the SL version was deemed more comprehensible for two items (i1, i3). Regarding the remaining items, preferences were almost evenly divided between SL and PL. However, it should be noted that the size of the subsamples of experts in Part III was very small (n = 9). These findings align with the comprehensibility ratings (in Part I), revealing only small and inconsistent differences in comprehensibility between the two language versions.
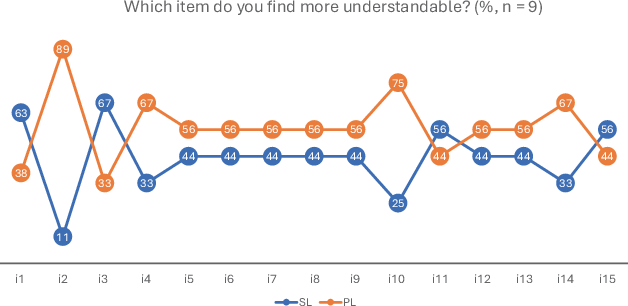
Fig. 3 Pairwise Comprehensibility Assessment (in Percent).The figure displays the percentage of experts indicating which language version (plain language (PL) or standard language (SL) they considered more understandable for each item pair. Values can range from 0% to 100%. Higher percentages indicate a stronger preference for the respective language version, while values close to 50% indicate no clear preference between PL and SL
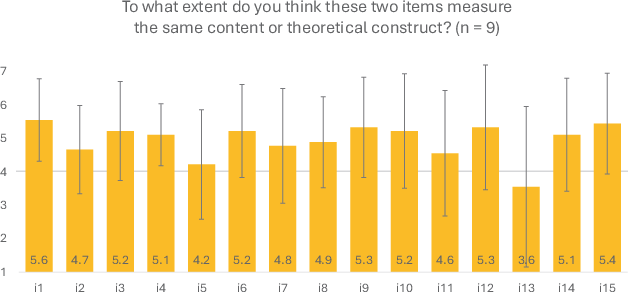
In Part II, experts assessed the comparability of item pairs in SL and PL by rating the extent to which each pair measured the same underlying construct. Comparability ratings ranged from 3.6 to 5.6, with most items receiving values above the scale mean, indicating relatively high comparability overall (see Fig. 4). The standard deviations of the comparability ratings were generally moderate (around 1.2–1.7 on a 7-point scale), indicating a fair degree of agreement among experts. However, a few items (i.e., i11–i13) showed higher variability (up to 2.4), suggesting that their comparability was more controversial and less consistently judged. Again, however, it should be noted that the size of the subsamples of experts in Part II was very small (n = 9). As a result, the standard deviations should be interpreted with caution, as individual ratings may disproportionately influence the spread.
Study II aimed to examine whether the inconclusive results of Study I could be attributed to the selection of participants, the design of the experimental stimuli, or the choice of comprehensibility measure. Using the same PL and SL items as in Study I, survey experts evaluated the items with two measures of comprehensibility and one measure of comparability.
Comprehensibility ratings were again very high across both language versions and, with few exceptions, experts rated the items in PL and SL as similarly comprehensible. A pairwise comprehensibility assessment supported this conclusion, showing that both language versions are equally comprehensible for most items. This suggests that the lack of differences in comprehensibility in Study I was not due to participant selection or the use of a closed-ended multi-item probe to measure comprehensibility. Moreover, the results of the pairwise comparability assessment indicate that the two language versions measured the same underlying theoretical construct for most items, suggesting that the PL translations did not meaningfully alter the core content or intent of the items.
Together, these findings suggest that the absence of differences in comprehensibility in Study I cannot be explained by participant selection or the measurement approach. Instead, it appears to be due to the experimental stimuli themselves, as the PL translations did not lead to consistent improvements in comprehensibility.
In two consecutive studies, we examined whether translating survey questions into PL improves comprehensibility and response quality in web surveys. In Study I, contrary to theoretical expectations and prior research, we found that PL did not enhance comprehensibility and, in some cases, was even associated with lower response quality than SL. By conducting supplementary analyses in Study II, we could show that these unexpected results were due primarily to the experimental stimuli. Specifically, the PL translations did not produce meaningful differences in comprehensibility, which helps explain why response quality did not improve compared with SL.
More broadly, this paper illustrates the value of supplementary analyses for understanding inconclusive or contradictory findings in survey research. While such findings are an inherent part of the research process and can be valuable in their own right, supplementary analyses help clarify underlying mechanisms and contextual factors, making results easier to interpret and integrate into the broader literature.
Based on two studies of PL, we showed how supplementary analyses can help address three potential sources of inconclusive findings in experimental research—the selection of participants, the design of experimental stimuli, and the choice of measures. Study I examined whether translating survey questions into PL improved comprehensibility and response quality compared with SL. The general assumption is that PL increases the comprehensibility of survey questions and thus reduces the effort and difficulty involved in answering them, which in turn should lead to higher-quality responses. However, contrary to expectations and previous research, PL did not enhance comprehensibility among respondents in Study I and was even associated with lower response quality for some items. Study II tested alternative explanations by keeping the experimental stimuli (PL vs. SL items) constant while varying participants (survey experts instead of respondents) and measures of comprehensibility (pairwise comparisons in addition to ratings). Across both participant groups and measures, PL and SL items were rated as similarly comprehensible, suggesting that the experimental stimuli did not cause any noticeable differences in comprehensibility. This finding clarifies why Study I failed to show improvements in response quality: In the absence of enhanced comprehensibility, improvements in response quality cannot be expected.
A key takeaway from these studies is that the absence of improvements in comprehensibility of survey questions translated into PL appears to stem from unsystematic translation practices. The translators in our study were experts in PL but not necessarily experienced in translating survey questions. The translation process did not provide for any briefing or reviewing sessions with the translators or for alternative translations from independent translators. The translated items were used without further revision or optimization by survey experts or pretesting with respondents from the target group. Moreover, existing PL guidelines provide only general style advice rather than recommendations tailored to specific target groups (Maaß 2020), and specific PL guidelines that consider relevant survey and respondent characteristics are still lacking. This reliance on individual translation skills and ad hoc approaches may result in PL translations that differ across studies, beyond the intended measurement of different content, which likely contributes to inconsistent results across studies.
To improve comprehensibility of survey questions in future studies by translating them into PL in a reliable and reproducible manner, we advocate (1) establishing PL translation standards, including tailored guidelines that take the specific characteristics of the target group (e.g., literacy) and the survey context (e.g., survey mode) into account; (2) fostering closer collaboration between survey researchers and PL translation professionals; and (3) conducting systematic pretesting with respondents from the target group. Furthermore, to increase reproducibility and interpretability of findings, we emphasize the importance of documenting and transparently reporting the translation procedures in line with best practices in multilingual survey research, such as the TRAPD (Translation, Review, Adjudication, Pretesting, and Documentation) framework.
Current developments in artificial intelligence (AI) offer new opportunities to support the translation and adaptation of survey questions according to PL principles. AI-based tools can simplify complex sentence structures and adapt vocabulary for large amounts of text within a short time, while maintaining the original meaning and intent of the text. In addition, they can increase standardization across survey questions and studies, ensuring that translation decisions are applied more consistently than in purely manual processes. Nonetheless, to ensure comparability and comprehensibility, survey questions translated into PL using AI translation tools must also be edited by expert reviewers and pretested with respondents from the target group.
More broadly, our paper highlights several implications for survey research. First, inconclusive findings should be treated as opportunities for methodological reflection. Second, supplementary analyses are a valuable tool to disentangle substantive effects from methodological artifacts. Third, standardized translation practices are essential to improve the comparability and quality of results across languages and contexts. Researchers can enhance their understanding and improve translation processes in future studies by learning from the translation challenges outlined in scientific publications.
The anonymized datasets used for analyses are accessible in the GESIS Data Archive: https://doi.org/10.7802/3048.
AAPOR (2023). Standard definitions. Final dispositions of case codes and outcome rates for surveys (10th ed.). https://aapor.org/wp-content/uploads/2023/05/Standards-Definitions-10th-edition.pdf →
Bauer, I., Kunz, T., & Gummer, T. (2025). Plain language in web questionnaires: Effects on data quality and questionnaire evaluation. International Journal of Social Research Methodology, 28(1), 57–69. https://doi.org/10.1080/13645579.2023.2294880. a, b, c, d, e
Beatty, P. C., & Herrmann, D. (2002). To answer or not to answer: Decision processes related to survey item nonresponse. In R. M. Groves, D. A. Dillmann, J. L. Eltinge & R. J. A. Little (Eds.), Survey nonresponse (pp. 71–86). Wiley. →
Beatty, P. C., & Willis, G. B. (2007). Research synthesis: The practice of cognitive interviewing. Public Opinion Quarterly, 71(2), 287–311. https://doi.org/10.1093/poq/nfm006. →
Behr, D., Meitinger, K., Braun, M., & Kaczmirek, L. (2017). Web probing—Implementing probing techniques from cognitive interviewing in web surveys with the goal to assess the validity of survey questions (Version 1). GESIS Survey Guidelines. https://www.ssoar.info/ssoar/handle/document/56166 →
DeCastellarnau, A. (2018). A classification of response scale characteristics that affect data quality: A literature review. Quality & Quantity, 52, 1523–1559. https://doi.org/10.1007/s11135-017-0533-4. →
Gibbons, J. L., Zellner, J. A., & Rudek, D. J. (1999). Effects of language and meaningfulness on the use of extreme response style by Spanish-English bilinguals. Cross-Cultural Research, 33(4), 369–381. https://doi.org/10.1177/106939719903300404. →
Hank, K., Gummer, T., Bujard, M., Neyer, F. J., Pollak, R., Spieß, C. K., Wolf, C., Christmann, P., Kunz, T., Lück, D., Naderi, R., Nutz, T., Schmid, L., & Thönnissen, C. (2025). A new data infrastructure for family research and demographic analysis: The German Family Demography Panel Study (FReDA). European Sociological Review, 41(2), 316–328. https://doi.org/10.1093/esr/jcae019. →
Hansen-Schirra, S., & Maaß, C. (2020). Easy language, plain language, easy language plus: Perspectives on comprehensibility and stigmatisation. In S. Hansen-Schirra & C. Maaß (Eds.), Easy language research: Text and user perspectives (pp. 17–38). Frank & Timme. a, b, c
Holbrook, A. L., Cho, Y. I., & Johnson, T. P. (2006). The impact of question and respondent characteristics on comprehension and mapping difficulties. Public Opinion Quarterly, 70(4), 565–595. https://doi.org/10.1093/poq/nfl027. →
Krosnick, J. A. (1991). Response strategies for coping with the cognitive demands of attitude measures in surveys. Applied Cognitive Psychology, 5(3), 213–236. https://doi.org/10.1002/acp.2350050305. a, b, c
Krosnick, J. A. (2002). The causes of no-opinion responses to attitude measures in surveys: They are rarely what they appear to be. In R. M. Groves, D. A. Dillmann, J. L. Eltinge & R. J. A. Little (Eds.), Survey nonresponse (pp. 87–102). Wiley. →
Kulas, J. T., & Stachowski, A. A. (2009). Middle category endorsement in odd-numbered Likert response scales: Associated item characteristics, cognitive demands, and preferred meanings. Journal of Research in Personality, 43(3), 489–493. https://doi.org/10.1016/j.jrp.2008.12.005. →
Kunz, T., Gummer, T., & Neuert, C. E. (2026). Measurement quality of a multi-item scale in plain language. Field Methods, 38(1), 33–45. https://doi.org/10.1177/1525822x251322031. a, b, c, d
Lenzner, T. (2012). Effects of survey question comprehensibility on response quality. Field Methods, 24(4), 409–428. https://doi.org/10.1177/1525822x12448166. →
Lenzner, T., Kaczmirek, L., & Lenzner, A. (2010). Cognitive burden of survey questions and response times: A psycholinguistic experiment. Applied Cognitive Psychology, 24(7), 1003–1020. https://doi.org/10.1002/acp.1602. a, b, c
Leskelä, L., Mustajoki, A., & Piehl, A. (2022). Easy and plain languages as special cases of linguistic tailoring and standard language varieties. Nordic Journal of Linguistics, 45(2), 194–213. https://doi.org/10.1017/S0332586522000142. →
Maaß, C. (2020). Easy Language—Plain Language—Easy Language Plus : Balancing comprehensibility and acceptability. Frank & Timme. →
Moy, P., & Murphy, J. (2016). Problems and prospects in survey research. Journalism & Mass Communication Quarterly, 93(1), 16–37. https://doi.org/10.1177/1077699016631108. →
Neuert, C. E., Meitinger, K., & Behr, D. (2023). Open-ended versus closed probes: Assessing different formats of web probing. Sociological Methods & Research, 52(4), 1981–2015. https://doi.org/10.1177/00491241211031271. →
Neuert, C. E., Kunz, T., & Gummer, T. (2025). An empirical evaluation of probing questions investigating question comprehensibility in web surveys. International Journal of Social Research Methodology, 28(3), 367–378. https://doi.org/10.1080/13645579.2024.2391957. →
Olson, K. (2010). An examination of questionnaire evaluation by expert reviewers. Field Methods, 22(4), 295–318. https://doi.org/10.1177/1525822x10379795. →
Roberts, C., Gilbert, E., Allum, N., & Eisner, L. (2019). Satisficing in surveys: A systematic review of the literature. Public Opinion Quarterly, 83(3), 598–626. https://doi.org/10.1093/poq/nfz035. a, b, c
Schriver, K. A. (1989). Evaluating text quality: The continuum from text-focused to reader-focused methods. IEEE Transactions on Professional Communication, 32(4), 238–255. →
Shoemaker, P. J., Eichholz, M., & Skewes, E. A. (2002). Item nonresponse: Distinguishing between don’t know and refuse. International Journal of Public Opinion Research, 14(2), 193–201. →
Velez, P., & Ashworth, S. D. (2007). The impact of item readability on the endorsement of the midpoint response in surveys. Survey Research Methods, 1(2), 69–74. https://doi.org/10.18148/srm/2007.v1i2.76. →
Yan, T., & Tourangeau, R. (2008). Fast times and easy questions: The effects of age, experience and question complexity on web survey response times. Applied Cognitive Psychology, 22(1), 51–68. https://doi.org/10.1002/acp.1331. →