The online version of this article (https://doi.org/10.18148/srm/2026.v20i2.8525) contains supplementary material.
A fundamental aspect of survey data quality is reliability. This issue is vital because if the answers that respondents provide to a measure differ from one occasion to another, then the responses observed in a survey may reflect random departures from the true value not the true value itself (Lord and Novick 1968). A solution to this problem is writing questions that respondents can interpret and answer consistently over time (Tourangeau et al. 2000). While this may seem straightforward, achieving high reliability is challenging; reliabilities for widely used survey measures are often not as high as the benchmark of 0.90 suggested by Nunnally (1978). For instance, Siegel and Hodge (1968) found a correlation of 0.85 when comparing individuals’ self-reports of personal income at two different time points. Scherpenzeel and Saris (1997), in a meta-analysis of 12 surveys in the Netherlands, reported an average reliability coefficient of 0.89.
Previous research has shown that low reliabilities may be related to question content, with attitudinal questions—focused on more abstract or complex concepts—being less reliable than factual questions (Hout and Hastings 2016; Tourangeau et al. 2021). For example, Alwin (2007) found average reliabilities of 0.85 for factual questions compared to 0.66 to 0.68 for non-factual questions in an analysis of the U.S. General Social Survey.
Studies have also shown that reliability may differ across countries and cultures. Differences can arise if translated questions do not have identical meanings or if concepts are interpreted differently across cultures (Alwin et al. 1994; Harkness et al. 2004; Johnson 1998). For instance, reliability for a life satisfaction question ranged from 0.68 to 0.74 across four countries (Lucas and Donnellan 2012). Scherpenzeel and Saris (1993) found significant variation in reliability estimates for several satisfaction measures in a meta-analysis of surveys from 10 European countries. Similarly, Chylíková (2021) observed statistically significant differences in reliability estimates between Central and Eastern European countries and the rest of Europe for two items from a European Union survey.
Research also points to differences in reliability over time in longitudinal surveys, potentially due to panel conditioning as participants become more familiar with the survey process, resulting in more consistent responses (Sturgis et al. 2009). For example, item reliabilities for four scales increased over 11 waves in the British Household Panel Survey (Sturgis et al. 2009). Cernat (2015), analyzing 46 survey items over four waves in the Understanding Society Innovation Panel in the UK, found a slight increase in average reliability over time. Additionally, Cernat and Oberski (2023) used data from the same panel and observed a slight decrease in random measurement error over three waves.
When interpreting previous findings, it is important to recognize that differences may arise from the various methods used to estimate reliability, each with unique assumptions. One common approach—interview-reinterview correlation—typically assumes no true score changes or memory effects between interviews. Multi-trait multi-method (MTMM) models (Andrews 1984; Saris and Gallhofer 2007) estimate both method effects and reliability by using multiple items that measure different constructs with different question formats; however, when these items are administered together in a single survey, reliability estimates may partly capture respondents’ memory of their earlier answers. Quasi-simplex models (Heise 1969; Alwin 2007) use data from three or more waves of longitudinal data and do not require assumptions about memory effects; instead, they require that error variances remain constant across waves (Wiley and Wiley 1970). A key advantage of the quasi-simplex approach is that it enables the estimation of reliability using existing panel data. For a comprehensive review of these methods, see Tourangeau (2021).
In this paper, we examine the reliability of widely used survey measures in national panel studies across contexts and over time. We do so using data from the Comparative Panel File (CPF 2023), which harmonizes data from long-running household panel surveys in seven countries, making it possible to estimate reliability on a large scale. Using quasi-simplex models, we estimate the reliability of 11 factual and 5 non-factual (self-assessment) survey indicators in each country over a 20-year period.
First, we estimate the reliability of each survey item using data from all countries and points in time. Understanding the reliability of these items is important in its own right, as it provides researchers with valuable information for evaluating data quality and interpreting results; if reliability is low, it can reduce the precision of estimates, attenuate correlations, and bias regression results (Alwin 2007; Fuller 1987; Saris and Revilla 2016). A key issue we examine is the extent to which question content influences reliability. While prior studies have found that non-factual items exhibit about 20–22% lower reliability compared to factual measures (Alwin 2007), to our knowledge, no previous research has explored this issue using panel data from multiple countries.
Next, we investigate how reliability varies by country, challenging the often-untested assumption that measurement reliability is equal across diverse contexts. While some research has explored cross-national differences in item reliability, such analyses have largely been restricted to data from the U.S. and Western Europe (Chylíková 2021; Lucas and Donnellan 2012); comparatively little is known about reliability patterns in other cultural settings. Additionally, we conduct a longitudinal evaluation of how reliability varies over a 20-year period, motivated by evidence from the UK suggesting that survey reliability may increase over time as panel members become more familiar with the questions being asked (Cernat and Oberski 2023; Sturgis et al. 2009). However, it remains an open question whether similar patterns exist in survey panels from a wider range of countries, as this has not been systematically examined to date.
Finally, we compare the reliabilities of questions that are worded differently across the panels. We first examine self-assessment questions administered with either longer (10-point) or shorter (5-point or 7‑point) scales. Prior research suggests that attitude questions with fewer response options tend to yield more reliable answers, likely because simpler scales make the available choices easier to distinguish (Alwin et al. 2018; Revilla et al. 2014). However, it is less clear whether this finding applies to self-assessment questions, since respondents presumably have access to more information about themselves than about external (attitude) objects and may therefore benefit from the finer distinctions provided by longer scales. To date, findings for self-assessment questions remain mixed. Some studies report greater reliability with 5‑point scales (Revilla et al. 2014), while others find advantages in using longer scales (Alwin and Krosnick 1991).
Additionally, we examine a self-rated health (SRH) question that varies across countries in its reference period–assessing either current health or health in general. According to Garbarski (2016), prior methodological research on SRH has largely focused on the order of response options and the sequencing of questions, with limited attention given to the effects of specifying a reference period. Given that respondents consider a wide array of health factors in their assessments (Jylhä, 2009), it is plausible that specifying a reference period influences the types of health factors respondents emphasize; for example, assessments of “health in general” may draw more on stable, long-term considerations, whereas “current health” may be shaped by temporary or situational factors. If so, asking about health in general could potentially yield more reliable answers.
In summary, we use data from the CPF to address the following research questions:
The CPF is a harmonized dataset compiled from household panel surveys in seven countries. They are as follows:
Australia: The Household, Income and Labor Dynamics in Australia Survey (HILDA),
Germany: The German Socio-Economic Panel (SOEP),
United Kingdom: The British Household Panel Survey (BHPS) and Understanding Society—The UK Household Longitudinal Study (UKHLS),
South Korea: The Korean Labor and Income Panel Study (KLIPS),
Russia: The Russian Longitudinal Monitoring Survey (RLMS),
Switzerland: The Swiss Household Panel (SHP), and
the United States: The Panel Study of Income Dynamics (PSID).
These studies are intended to be representative of the population of households in their respective countries. Each of them has added sample members over time by including new household members (e.g., grown-up children) and refreshment samples (e.g., migrant families). The studies conduct annual interviews with one or more household member, except for PSID, which conducted interviews every other year. For more details about each panel survey, see Turek et al. (2021).
The CPF includes observations from individuals aged 18 and older who meet the eligibility criteria of their panel.1 The dataset has a hierarchical structure with: (1) repeated individual observations from different waves (2) clustered within individuals (3) who are clustered within countries. When constructing the file, observations with missing values for age and gender were deleted (Turek et al. 2021).
We analyzed CPF data from 2001 to 2020 and a total of 6,849,480 observations from 341,506 unique respondents. Table 1 shows the number of observations in each study.
Table 1 Number of waves and observations in each panel of the analytic sample
Country | Study | Waves | Observations n | Unique Respondents n |
*BHPS: 2001–2008, 8 waves; Understanding Society: 2009–2020, 12 waves. | ||||
Australia | HILDA | 20 | 637,940 | 31,897 |
Germany | SOEP | 20 | 1,745,620 | 87,281 |
Russia | RLMS | 20 | 1,240,840 | 40,917 |
South Korea | KLIPS | 20 | 651,300 | 32,562 |
Switzerland | SHP | 20 | 560,040 | 28,002 |
United Kingdom | BHPS/UKHLS* | 20 | 2,184,120 | 97,469 |
United States | PSID | 10 | 467,560 | 23,378 |
Our goal was to analyze as many variables as appropriate given our analytic technique. To achieve this, we included all numeric and ordinal variables that were not missing in more than two countries and that had not been corrected based on answers from previous waves (e.g., year of birth). This selection process yielded 14 survey indicators, which are presented in Table 2.2 Satisfaction questions were harmonized into either 5‑point scales or 10-point scales; our analysis focuses on the 10-point version. The CPF codebook provides the question wording for these items (Turek et al. 2023).3
Table 2 Description of survey variables used in the analysis
Variable Label | Description | Missing Data |
Factual | ||
Education | Education: 5 levels | |
Num. children | Number of children in HH aged 0–17 | UK |
HH size | Number of people in HH | |
hrs worked | Work hours per week: worked | |
Emp. size | Size of organization: 5 levels | Australia, Germany |
Ind. income | Individual labor earnings (all jobs, year, gross)—we recoded and capped at the 95th percentile and took the log. As a result, this now includes only youth who had income | Russia |
HH income | Household income (month, post)—we recoded and capped at the 99th percentile, added 1000, and took the log | |
Work exp. | Labor market experience | South Korea, UK |
Religious att. | Frequency of attendance at religious services | |
Non-factual | ||
SRH | Self-rated health (5 categories) | |
Sat. HH fin. | Satisfaction: financial situation of HH | USA |
Sat. income | Satisfaction: individual income | USA |
Sat. work | Satisfaction: work | USA, UK |
Sat. life | Satisfaction: life | US, UK |
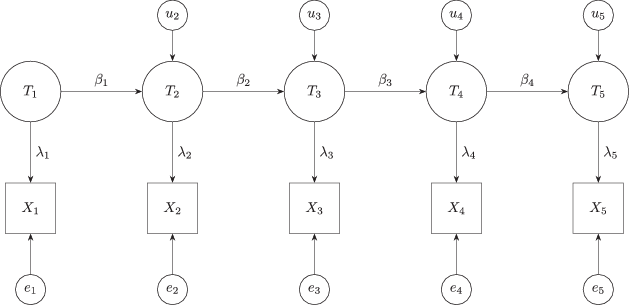
To estimate the reliability of our variables, we leverage the longitudinal design of the survey panels and apply the quasi-simplex model. This approach, based on the Structural Equation Modelling framework, can estimate reliability for variables measured across at least three waves of data, with a separate model fit for each variable. We chose the quasi-simplex model over interview-reinterview or MTMM approaches for several reasons. First, it can be applied to single questions that are not part of multi-item scales. Second, it does not rely on assumptions about memory effects (i.e., respondents recalling previous answers), thereby avoiding a potential source of bias in reliability estimates. Third, it does not require any special survey design, allowing us to estimate reliability using existing panel data under realistic survey conditions.
The basic formula for the quasi-simplex model (Alwin 2007) can be expressed using two components: a measurement equation and a structural one. The measurement model is estimated using the equation:
Where Xt is the observed variable at time point t, Tt is a latent variable, λt is a factor loading, and et represents the residual or random error. The model is extended to include an auto-regressive model that structurally connects the latent variables:
Where Tt−1is the trait at the previous wave, βt−1 is a regression coefficient indicating the amount of stability from one wave to another, and ut is the residual and represents reliable time-specific variance.
Given that we are analyzing 20 years of data, we will run the quasi-simplex model for five time points in each model (2001 to 2005, 2006 to 2010, and so forth). In cases where data is collected every two years, like in the case of PSID in the USA, we will still use five waves, but it will be over ten years of data. We can also visually represent the five-wave quasi-simplex model using an SEM diagram (Fig. 1).
This model estimates reliability at each point in time as the proportion of variation explained by the trait (Tt) as opposed to random error (et). To estimate the model, restrictions need to be added. The most common approach restricts the variance of the residual (et) to be equal in time. This has been shown to be robust in most applications (Alwin 2007; Cernat and Sakshaug 2021). We also use this restriction for our models.
We run the quasi-simplex model separately for each country and variable over five waves, producing five reliability estimates per variable and country. We then extract these estimates for analysis to address our research questions. Reliability will be examined using descriptive statistics and regression models. The regression models will predict reliability as a function of question content, country, time, and question characteristics (see Tables A2, A3 and A5).
We initially analyzed all the models using the lavaan (Rosseel 2012) package in R (v. 4.3.2) with Maximum Likelihood estimation. For models that had issues with convergence (e.g., negative variances), we re-run the models using Bayesian estimation using the blavaan package (Merkle and Rosseel 2018).4 The models assume Missing At Random (Enders 2010) by using Full Information Maximum Likelihood.
Variables from some countries and waves were excluded if they had only missing data or if they were asked only for a subgroup (e.g., only for new panel members; see details in the Appendix). After these exclusions, 291 models were run, each covering five time points. Of these models, 49 did not converge or had negative variances (Heywood cases)5. These models were rerun using Bayesian estimation and converged without issues. The number of models we have for each combination of variable and country is listed in Table A1 in the Appendix. The overall fit of the models appears adequate, with an average RMSEA of 0.028.
Given that there is no perfect overlap between all the countries and variables, for some of the research questions we do a sensitivity analysis using only the five variables that are present in all countries: household income, number of people in the household, satisfaction with life, work hours per week, and SRH.
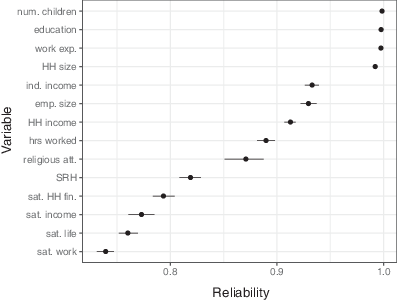
Our first research question investigates the level of reliability of frequently administered items in household panel surveys. Across all variables, countries, and time points, the overall reliability is 0.885, indicating moderate to high reliability. However, this average hides considerable variation depending on the specific variable. Fig. 2 shows the average reliability by item. Some variables, such as household size and education, have almost perfect reliability (close to 1), while others, such as satisfaction with life and SRH tend to have average reliabilities in the range of 0.70 to 0.85. Variables such as income, work hours per week, and religious attendance fall between these extremes, with average reliabilities of 0.85 to 0.95. This variation highlights the importance of considering question content and characteristics when assessing reliability.
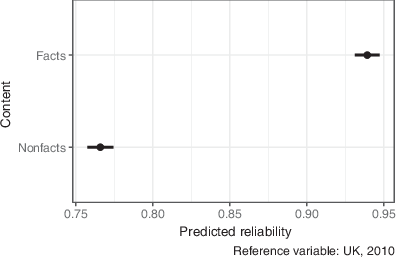
We next examined the extent to which non-factual questions produced less reliable answers than factual question. To formally test how question content affects reliability, we build a regression model that includes question content, country, and time as predictors (see Table A2 in the Appendix). As expected, the model indicates lower reliability for non-factual questions compared to factual questions (Fig. 3). The predicted average reliability for factual items is close to 0.94, whereas for non-factual items it is close to 0.77—a difference of 0.17, corresponding to a percent reduction of approximately 18%. This substantial difference underscores the inherent challenge of obtaining reliable answers to non-factual questions and mirrors patterns observed in prior surveys conducted in the USA (Alwin 2007).
Our second research question investigates how reliability varies by country (Table 3). When aggregating reliability scores by country, we find that data from South Korea and Russia exhibit the lowest average reliabilities (around 0.85). At the other extreme, data from Germany and the USA have the highest average reliabilities, at 0.91 and 0.94, respectively.
Table 3 Average reliability and bootstrapped confidence intervals per country
Country | Reliability | Std.error | Conf.low | Conf.high | n |
USA | 0.936 | 0.008 | 0.919 | 0.951 | 360 |
Germany | 0.911 | 0.005 | 0.901 | 0.921 | 980 |
Australia | 0.899 | 0.006 | 0.887 | 0.910 | 960 |
Switzerland | 0.893 | 0.006 | 0.882 | 0.904 | 1000 |
UK | 0.868 | 0.008 | 0.852 | 0.882 | 680 |
Russia | 0.859 | 0.007 | 0.846 | 0.875 | 920 |
South Korea | 0.853 | 0.008 | 0.836 | 0.870 | 920 |
These averages could potentially be confounded by the fact that countries have different variables that were analyzed. If we restrict the descriptive statistics to the five items present in all the countries, we get similar results, although with different rankings (Figure A1 in the Appendix). South Korea and Russia again have the lowest average reliabilities (around 0.85), while Germany, Australia, the USA, and the UK have average reliabilities of around 0.9.
To further assess whether country differences are statistically significant, we fit a regression model that includes country, variable, and time as predictors (Table A3 in the Appendix). The result from this model (Fig. 4) indicate that Russia and South Korea exhibit significantly lower predicted reliabilities compared to the other countries.
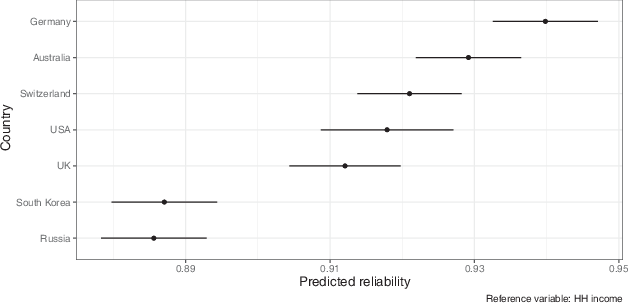
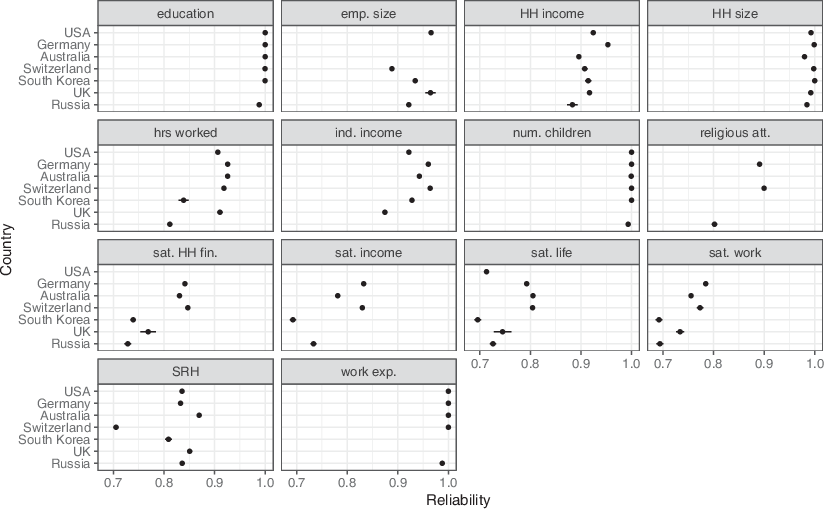
These results nevertheless hide significant variation in reliability across countries for specific items. Fig. 5 shows that for factual questions in which reliability is high, there is notable consistency across countries. By contrast, variables with lower reliabilities display more heterogeneity in reliability across countries. For example, while panel data from Switzerland generally exhibits high reliability, it has the lowest reliability for SRH. (See Table A4 in the Appendix for the standard deviation of the average reliability for each item across different countries).
Thus, our findings do not fully support the common assumption of equal reliability across countries. Rather, we observe considerable variation—particularly for non-factual items—highlighting the challenges inherent in cross-national comparisons for self-reported attitudes and perceptions. These results underscore the importance of careful interpretation when comparing such measures across countries.
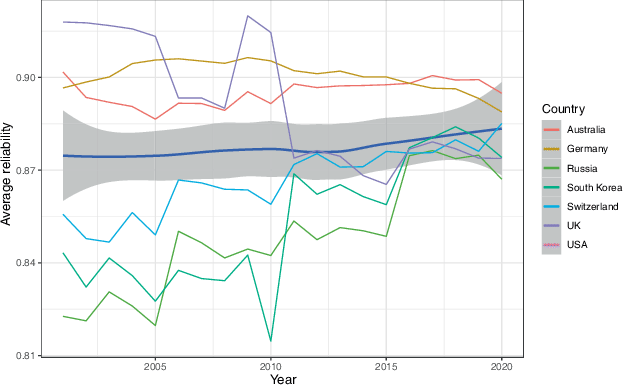
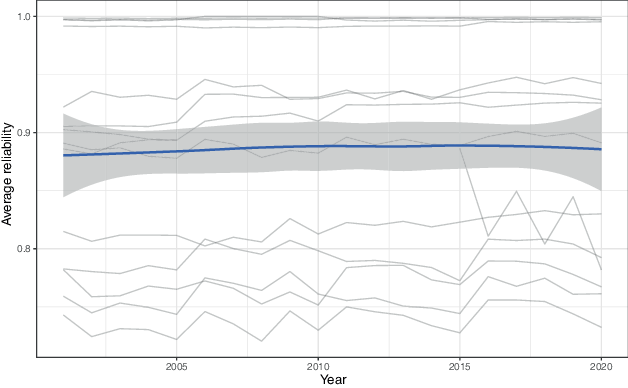
The next research question examines how stable the reliabilities are over the 20 years of data we analyze, considering that reliability may increase over time (e.g., as respondents become more familiar with the questions after repeated administrations). A visual inspection of the average reliability by variable (Fig. 6) suggests that reliabilities have remained relatively stable over time, both overall and for specific questions (see Appendix Figure A2).
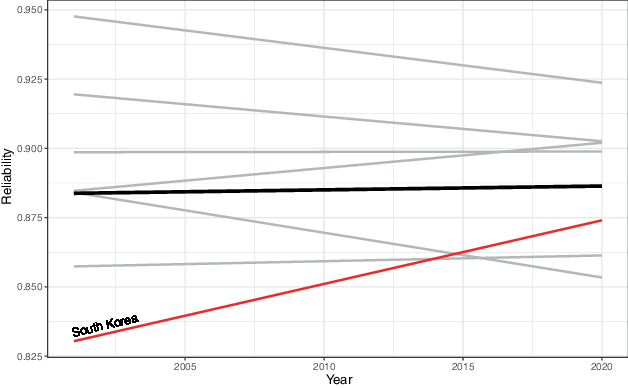
However, when examining average reliability by country (Fig. 7), more pronounced patterns emerge. Notable is a decrease in reliability in the UK data after 2009 and a general upward trend in reliability for the South Korean data over the 20 years.
To determine whether these trends are systematic, we modeled reliability as a function of country, time, and interactions between them (see Table A5 in Appendix). The model results support the observation of a systematic improvement in the reliability of South Korean data. Fig. 8 presents the predicted scores by country and highlights the upward trend for South Korea. These findings indicate that, despite broad stability, there are meaningful longitudinal changes in reliability within certain countries that warrant further attention.
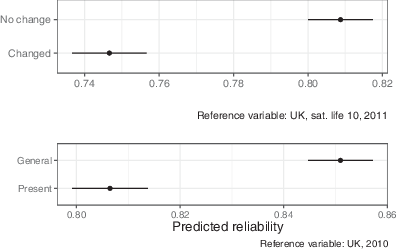
The next research question explores how the number of scale points for the satisfaction measures affect reliability. The satisfaction measures were administered using 5‑point scales in the USA, South Korea, and Russia; 7‑point scales in the UK; and 10-point scales in Australia, Switzerland, and Germany. These questions were subsequently harmonized into 10-point scales for analysis. This allows us to distinguish between questions that originally used 10-point scales (which required no change for harmonization) and those that originally used shorter scales (which were recoded). The relationship between scale length and reliability was evaluated using a regression model with scale type, country, and year as predictors (see Table A2 in the Appendix). The predicted reliabilities for each scale type are presented in Fig. 9. The results indicate that satisfaction questions originally using 10-point scales (labeled “no change”) have significantly higher reliability, averaging around 0.81, compared to the 5‑ or 7‑point scales, which averaged around 0.75. These findings suggest that the original response scale length has an impact on reliability for these questions, with longer, unmodified scales producing more reliable answers.
Finally, we explore whether question wording differences for the SRH measure affected its reliability. Respondents were asked about their health “in general” in the USA, UK, and Australia; their health “right now” in Switzerland; and their current health or given no explicit reference point in Korea, Russia, and Germany. We fit a regression model that includes reference period (in general vs. present), country, and year as predictors (see Table A2 in the Appendix). As shown in Fig. 9, asking about health in general tends to yield higher reliability (0.85) compared to asking about current health (0.81). These results suggest that broader, less time-specific wording can produce more reliable answers.
Reliability in survey measurement is a crucial aspect of data quality. Our systematic, large-scale longitudinal analysis of this issue yielded the following findings. First, overall reliability in long-running household panel studies was moderate to high but varied considerably depending on the content of the questions. Second, non-factual items tended to have substantially lower reliabilities, with an average reduction of 18% compared to factual items. Third, there was considerable variation in reliability by survey context, with panel data from Germany and Australia exhibiting higher average reliability than panel data from South Korea and Russia. Fourth, reliability in the survey panels did not increase over time, except in one panel (South Korea). Finally, variation in question wording led to different levels of error, with higher reliability for self-assessment questions that used 10-point scales compared to shorter scales and SRH questions that asked about health in general compared to current health.
This study’s results are limited by the fact that varying data collection procedures were used across different panels, but this diversity is also a strength, as it provides comprehensive view of reliability across different real-world survey situations. Yet the differences observed could be due to cultural and linguistic factors, as well as differences in data collection modes, sample designs, and other survey procedures (Roberts et al. 2020). This indicates a need for a larger meta-analysis to isolate the effects of these variables on reliability.
The study highlights that panel surveys rarely achieve high reliability (> 0.90) for self-rating measures, such as satisfaction with work, which had an average reliability of 0.74. These levels of reliability likely generalize to cross-sectional surveys, though they would be more difficult to estimate. Low reliability can significantly bias panel data analyses and affect substantive conclusions (Alwin 2007; Fuller 1987; Saris and Revilla 2016). As such, researchers should consider applying statistical corrections for measurement error (see e.g., Alwin 2007; Scherpenzeel and Saris 1993).
Our findings point to several implications for designing non-factual survey items. Survey researchers should devote added attention to creating self-assessment questions (such as self-evaluations or self-descriptions) that are easy for respondents to interpret and answer consistently. While shorter response scales (e.g., 5 points) can yield higher-quality data for certain types of attitude questions (Krosnick 1999), 10-point scales may provide greater precision for self-assessment items. Additionally, asking about general health tends to yield more stable responses than asking about current health, which can be affected by temporary conditions (Jylhä 2009). Future research could further explore how these questionnaire design choices affect reliability by using randomized experiments with repeated measurements.
In cross-national and cross-cultural research, analysts often assume consistent measurement error levels across regions and countries when survey items appear comparable in wording. However, this study shows that this assumption does not always hold true, even for factual items. For example, the average reliability of a measure of “work hours per week” ranged from 0.81 in Russia to 0.93 in Germany and Australia. Harmonizing these measures into a single variable may mask underlying country-specific measurement differences, leading to incorrect substantive conclusions in comparative analyses (see Smith 2018).
In interpreting our findings, we note that the quasi-simplex model makes some assumptions in order to estimate reliability. However, the standard configuration used in this analysis has been shown to be robust (Cernat and Sakshaug 2021). We have also treated the reliability estimates from the model as fixed in the second part of the analyses (tables, graphs and regression models) and this might underestimate the amount of uncertainty we have in reality.
Nonetheless, our results contribute to the growing body of knowledge on overall levels of reliability in survey data across diverse contexts. Future research should further investigate this topic in multinational surveys that aim for consistent procedures across countries (e.g., European Social Survey, International Social Survey Programme, Afrobarometer, and Living Standards Measurement Study). Such research could provide greater insights into whether differences in reliability stem from study-specific design factors or broader cultural and linguistic influences.
Alwin, D. F. (2007). Margins of error: a study of reliability in survey measurement. Wiley. a, b, c, d, e, f, g, h, i
Alwin, D. F., & Krosnick, J. A. (1991). The reliability of survey attitude measurement: the influence of question and respondent attributes. Sociological Methods & Research, 20(1), 139–181. https://doi.org/10.1177/0049124191020001005. →
Alwin, D. F., Braun, M., Harkness, J., & Scott, J. (1994). Measurement in multi-national surveys. In I. Borg & P. Mohler (Eds.), Trends and perspectives in empirical social research (pp. 26–39). De Gruyter. https://doi.org/10.1515/9783110887617.26. →
Alwin, D. F., Baumgartner, E. M., & Beattie, B. A. (2018). Number of response categories and reliability in attitude measurement. Journal of Survey Statistics and Methodology, 6(2), 212–239. →
Andrews, F. M. (1984). Construct validity and error components of survey measures: a structural modeling approach. Public Opinion Quarterly, 48(2), 409–442. →
Cernat, A. (2015). The impact of mixing modes on reliability in longitudinal studies. Sociological Methods & Research, 44(3), 427–457. https://doi.org/10.1177/0049124114553802. →
Cernat, A., & Oberski, D. (2023). Estimating measurement error in longitudinal data using the longitudinal multitrait multierror approach. Structural Equation Modeling: A Multidisciplinary Journal, 30(4), 592–603. https://doi.org/10.1080/10705511.2022.2145961. a, b
Cernat, A., & Sakshaug, J. W. (2021). Estimating the measurement effects of mixed modes in longitudinal studies: current practice and issues. In P. Lynn (Ed.), Wiley series in probability and statistics (1st edn., pp. 227–249). Wiley. https://doi.org/10.1002/9781119376965.ch10. a, b
Chylíková, J. (2021). Comparison of reliability in seventeen European countries using the quasi-simplex model. In Measurement error in longitudinal data (p. 383). Oxford University Press. https://doi.org/10.1093/oso/9780198859987.003.0016. a, b
Comparative Panel, F. (2023). Data file version 1.5. https://www.cpfdata.com https://doi.org/10.17605/OSF.IO/H3YXQ. →
Enders, C. K. (2010). Applied missing data analysis (1st edn.). Guilford. →
Fuller, W. A. (1987). Measurement error models (1st edn.). Wiley. a, b
Garbarski, D. (2016). Research in and prospects for the measurement of health using self-rated health. Public Opinion Quarterly, 80(4), 977–997. →
Harkness, J., Pennell, B., & Schoua-Glusberg, A. (2004). Survey questionnaire translation and assessment. In S. Presser, J. M. Rothgeb, M. P. Couper, J. T. Lessler, E. Martin, J. Martin & E. Singer (Eds.), Methods for testing and evaluating survey questionnaires (1st edn., pp. 453–473). Wiley. https://doi.org/10.1002/0471654728.ch22. →
Heise, D. R. (1969). Separating reliability and stability in test-retest correlation. American Sociological Review, , 93–101. →
Hout, M., & Hastings, O. P. (2016). Reliability of the core items in the General Social Survey: estimates from the three-wave panels, 2006–2014. Sociological Science, 3, 971–1002. →
Johnson, T. P. (1998). Approaches to equivalence in cross-cultural and cross-national survey research. In J. Harkness (Ed.), Cross-cultural survey equivalence (pp. 1–40). Mannheim: Zentrum für Umfragen, Methoden und Analysen ZUMA. →
Jylhä, M. (2009). What is self-rated health and why does it predict mortality? Towards a unified conceptual model. Social Science & Medicine, 69(3), 307–316. a, b
Krosnick, J. A. (1999). Survey research. Annual Review of Psychology, 50(1), 537–567. →
Lord, F. M., & Novick, M. R. (1968). Statistical theories of mental test scores. IAP. →
Lucas, R. E., & Donnellan, B. M. (2012). Estimating the reliability of single-item life satisfaction measures: results from four national panel studies. Social Indicators Research, 105, 323–331. a, b
Merkle, E. C., & Rosseel, Y. (2018). blavaan: Bayesian structural equation models via parameter expansion. Journal of Statistical Software. https://doi.org/10.18637/jss.v085.i04. →
Nunnally, J. C. (1978). An overview of psychological measurement. In B. B. Wolman (Ed.), Clinical diagnosis of mental disorders (pp. 97–146). Springer US. https://doi.org/10.1007/978-1-4684-2490-4_4. →
Revilla, M., Saris, W. E., & Krosnick, J. A. (2014). Choosing the number of categories in agree/disagree scales. Sociological Methods & Research, 43, 73–97. a, b
Roberts, C., Sarrasin, O., & Stähli, M. E. (2020). Investigating the relative impact of different sources of measurement non-equivalence in comparative surveys: an illustration with scale format, data collection mode and cross-national variations. Survey Research Methods. https://doi.org/10.18148/srm/2020.v14i4.7416. →
Rosseel, Y. (2012). lavaan: an R package for structural equation modeling. Journal of Statistical Software, 48, 1–36. →
Saris, W. E., & Gallhofer, I. (2007). Estimation of the effects of measurement characteristics on the quality of survey questions. Survey Research Methods, 1(1), 29–43. →
Saris, W. E., & Revilla, M. (2016). Correction for measurement errors in survey research: necessary and possible. Social Indicators Research, 127, 1005–1020. a, b
Scherpenzeel, A., & Saris, W. (1993). The evaluation of measurement instruments by meta-analysis of multitrait-multimethod studies. Bulletin of Sociological Methodology/Bulletin de Méthodologie Sociologique, 39(1), 20–44. https://doi.org/10.1177/075910639303900102. a, b
Scherpenzeel, A. C., & Saris, W. E. (1997). The validity and reliability of survey questions: a meta-analysis of MTMM studies. Sociological Methods & Research, 25(3), 341–383. https://doi.org/10.1177/0049124197025003004. →
Siegel, P. M., & Hodge, R. W. (1968). A causal approach to the study of measurement error. Methodology in Social Research, , 28–59. →
Smith, T. W. (2018). Improving multinational, multiregional, and multicultural (3MC) comparability using the total survey error (TSE) paradigm. Advances in Comparative Survey Methods, , 13–43. →
Sturgis, P., Allum, N., & Brunton‐Smith, I. (2009). Attitudes over time: The psychology of panel conditioning. In P. Lynn (Ed.), Methodology of longitudinal surveys (pp. 113–126). Wiley. a, b, c
Tourangeau, R. (2000). The psychology of survey response. Cambridge University Press. →
Tourangeau, R. (2021). Survey reliability: models, methods, and findings. Journal of Survey Statistics and Methodology, 9(5), 961–991. →
Tourangeau, R., Yan, T., & Sun, H. (2021). Who can you count on? Understanding the determinants of reliability. Journal of Survey Statistics and Methodology, 8(5), 903–931. →
Turek, K., Kalmijn, M., & Leopold, T. (2021). The comparative panel file: harmonized household panel surveys from seven countries. European Sociological Review, 37(3), 505–523. a, b
Turek, K., Voets, I., & Kalmijn, M. (2023). Comparative Panel File: Codebook for CPF v.1.5. https://osf.io/3hdkn/download →
Wiley, D. E., & Wiley, J. A. (1970). The estimation of measurement error in panel data. American Sociological Review, 35(1), 112–117. →