Quick Response (QR) codes are two-dimensional barcodes that can be scanned using smartphones or tablets, directing users to a specific website or survey questionnaire. Although QR codes are not a new technology, their use has gained popularity, particularly since the COVID-19 pandemic, as a contactless method for transactions (Davies et al., 2023; Gostin, 2021). For survey methodologists, QR codes can be useful in contexts where initial contact with potential survey participants is established through physical invitation letters.
However, a key limitation of QR codes is that they require respondents to have a smartphone or tablet, which may not be accessible to everyone. Additionally, prior to 2017, most smartphones did not have built-in functionality to scan QR codes (Marlar & Schreiner, 2024). Since then, this feature has become standard on most smartphones, making QR codes more accessible for smartphone users.
The COVID-19 pandemic accelerated the adoption and use of QR codes, leading to a growing, though still limited, body of research testing their effectiveness in survey invitations. These studies reveal distinct differences in earlier and more recent findings. Earlier studies reported mixed findings: some found that including QR codes on survey invitations had no impact on participation (Lugtig & Luiten, 2021; Marlar, 2018), while others observed only a modest increase in response rates (Harrison et al., 2019; Patrick et al., 2022). In contrast, more recent studies have demonstrated that QR codes significantly improved participation rates and increased access to surveys via smartphones or tablets (Endres et al., 2023; Hupp et al., 2023; Olson & Ganshert, 2024).
While some studies found that QR codes enhanced participation among younger age groups, individuals from ethnic minority backgrounds, and those with lower educational attainment (Hupp et al., 2023; Leary et al., 2023; Lee et al., 2023; Mcdaniel et al., 2023), others did not find such effects (Olson & Ganshert, 2024). Marlar & Schreiner (2024) conducted two experiments from 2015 and 2022 and found that, in 2022, the inclusion of QR codes had a small but significant positive effect on response rates, particularly among Hispanic respondents—a result not observed in 2015.
There may also be data quality concerns since QR codes are typically accessed via smartphones. Some studies have reported that completing surveys on smartphones can take longer (Struminskaya et al., 2015; Maslovskaya et al., 2024), increase the likelihood of break-offs—especially when the questionnaires are not optimised for mobile completion (Mavletova & Couper, 2016), lead to higher item non-response (Mavletova & Couper, 2015; Struminskaya et al., 2015), and result in a greater tendency for respondents to engage in response style behaviours, such as primacy effects (Stapleton, 2013) and straightlining (Guidry, 2012; Maslovskaya et al., 2024). However, other research suggests that there are little to no differences in data quality between smartphone and PC/desktop users, including in response behaviours and measurement error (Keusch & Yan, 2017; Lugtig & Toepoel, 2015; Sommer et al., 2016; Stapleton, 2013).
QR codes are appealing for survey research because they can potentially reduce respondent burden by providing direct access to the questionnaire, eliminating the need to manually enter a URL from the invitation letter. This ease of access can potentially increase participation. QR codes can also eliminate the risk of errors in the URL when project acronyms are unfamiliar. Furthermore, they can boost participation from smartphone users, which is particularly valuable for surveys that require additional tasks, such as using apps. Additionally, because smartphone users tend to have specific characteristics, QR codes could potentially help attract higher proportions of younger individuals, ethnic minorities, and those with lower educational attainment.
Additional evidence is needed to obtain more conclusive results about the effectiveness of including QR codes in invitation and reminder letters for online survey access, particularly for long and complex self-administered surveys, as many high-quality surveys have already transitioned or are in the process of transitioning to self-administered modes of data collection. The UK GGS QR code experiment provides a unique opportunity to assess this, as it employed a long, complex questionnaire. Additionally, the GGS provided an opportunity to examine, within a probability-based sample, whether response rates can be increased without compromising data quality and whether using QR codes can help reach specific population subgroups.
This study formulated four hypotheses. First, response rates by letter condition are investigated, followed by an analysis of response rates by device type to assess the first two hypotheses: whether response rates are higher in the QR-with-URL letter condition (H1), and whether the proportion of smartphone users is higher in the QR-with-URL letter condition (H2). This is followed by bivariate analyses exploring the relationship between the experimental conditions and respondents’ demographic and socio-economic characteristics, addressing H3 (whether the QR-with-URL letter condition attracts a higher proportion of young people, ethnic minorities, and individuals with lower education levels). Finally, H4 is tested by comparing data quality indicators between the two conditions to determine if data quality is lower in the QR-with-URL letter condition.
Most previous studies have been conducted in the US, making it essential to report on experiments conducted in other countries. Perceptions of QR codes, along with familiarity and adoption rates, may vary across cultural contexts, highlighting the need for broader international research. In this study, the inclusion of a QR code alongside a URL in invitation letters for the experimental group allowed for an investigation of response rates, smartphone participation, demographic composition, and data quality in a probability-based online survey. However, similarly to some other studies (Asensio, 2024; Harrison et al., 2019; Lugtig & Luiten, 2021), a failure of this experiment was that it did not capture whether respondents accessed the survey via the QR code or the URL link. The QR code lacked two specific query parameters—the survey URL and a unique access code per respondent—which would have enabled survey practitioners to track QR code usage through an entry log. As a result, these findings only reflect the effects of including a QR code alongside a URL in invitation letters and follow-up reminders, compared with including a URL alone, rather than the effects of respondents actually using the QR code to access the survey.
This study contributes to the literature on the use of QR codes in survey invitation letters and highlights an important lesson: future studies should include mechanisms to distinguish how respondents access the survey (via QR code or URL) to allow for a more detailed assessment of the impact of QR code usage.
The QR code experiment was one of two independent experiments embedded in the UK Wave 1 Generations and Gender Survey (GGS), a probability-based online-only survey targeting UK residents aged 18–59 (Howe et al., 2024; Perelli-Harris et al., 2024). A stratified random probability-based sample of addresses was drawn from the Postcode Address File, and selected households were sent an invitation letter followed by two reminder letters. One respondent per household was invited to participate, with the respondent selected using the most recent birthday method.
The survey was conducted between September 2022 and February 2023 in two stages, with approximately half of the sample issued in each stage. During the first stage, an incentive experiment was carried out to assess the effectiveness of different incentive values on response rates and sample composition. The findings from this stage informed the targeted incentive approach implemented in the second stage, during which the QR code experiment was implemented to test differences in response rates and data quality by different survey access modes. These experiments are independent from each other and were carried out in different stages of data collection.
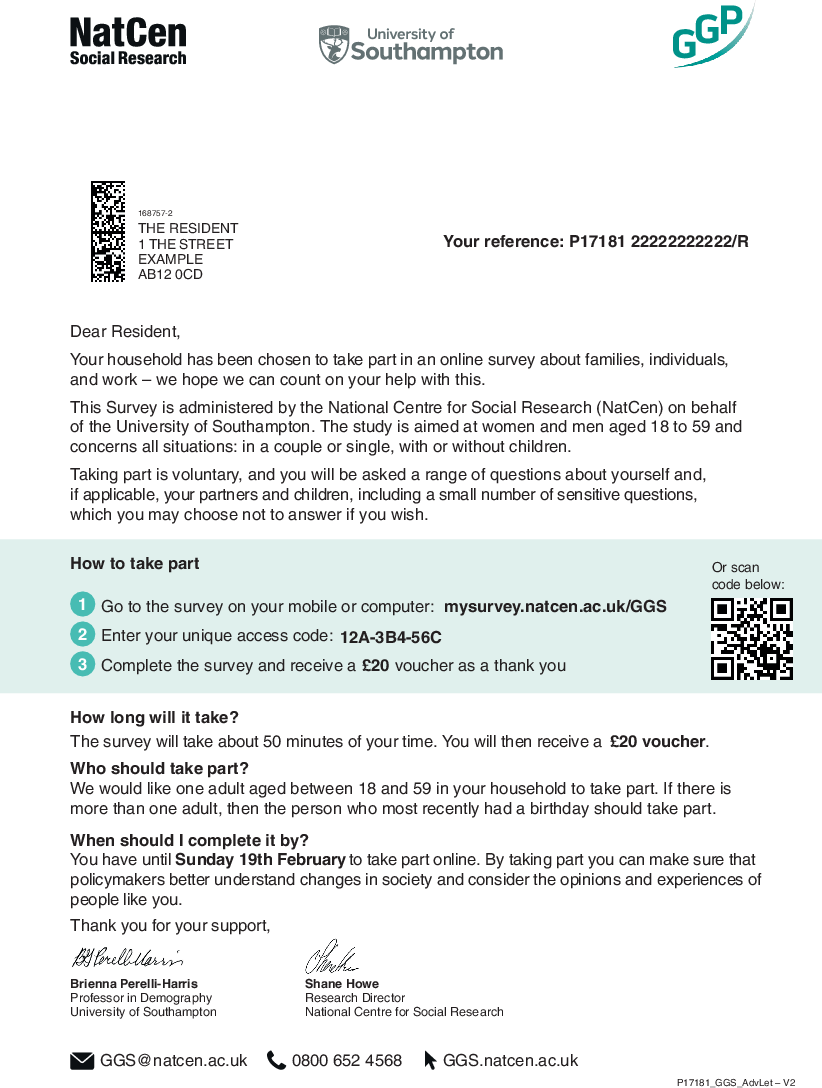
For the QR code experiment, 41,450 invitation letters were sent. Half of these letters contained only a URL to the survey, while the other half featured both a QR code and a URL (QR-with-URL letter condition). Each household was informed that the survey would take approximately 50 min to complete and that a voucher (£15 or £20) would be issued upon survey completion. An example of the invitation letter with a QR code can be found in Fig. 1. In addition, two reminder letters were sent to each sampled household, which differed in the same way as the initial invitation letter (with/without the QR code on the right side—see Howe et al. (2024) for all communication materials). This strategy resulted in a final productive sample of 3740 respondents.
To test H1 (differences in response rates and break-off rates), we calculated the AAPOR response rate 3 (RR3), and break-off rates by experimental conditions (AAPOR, 2023). To test H2 (differences in device used), H3 (differences in demographic composition), and parts of H4 (differences in data quality), chi-square tests are used, which are reported in Table 1. To investigate the association between experimental conditions and survey length, Mood’s median test (Mood, 1954) is employed, as survey length is a continuous measure. This nonparametric test allows for the comparison of medians without making assumptions about the underlying distributions.
Table 1 Distribution of respondent characteristics between treatment vs. control group along with indications of statistically significant differences using chi-square tests
URL-only | QR-with-URL | |||
n | % | n | % | |
The analytical sample used in the analysis comprises 3258 respondents, excluding respondents with missing values on the variables of interest Unweighted analysis. Fully productive responses only. Time spent on survey obtained from the survey’s paradata. The p‑values associated with the adjusted chi-square tests are indicated by ***p < 0.001, ** p < 0.01 and *p < 0.05. 1For extreme responses and straightlining, the table only reports the frequency of all those who responded with extreme values or straightlined across two attitudinal blocks, and the percentage is out of the total sample. | ||||
Device used*** | ||||
Desktop | 813 | 52 | 658 | 39 |
Smartphone | 699 | 45 | 984 | 58 |
Tablet | 56 | 4 | 48 | 3 |
Demographic characteristics | ||||
Sex | ||||
Male | 595 | 38 | 627 | 37 |
Female | 973 | 62 | 1063 | 63 |
Age | ||||
18–29 | 335 | 21 | 346 | 21 |
30–39 | 434 | 28 | 447 | 26 |
40–49 | 360 | 23 | 406 | 24 |
50–59 | 439 | 28 | 491 | 29 |
Education | ||||
Below degree | 744 | 48 | 833 | 49 |
Bachelor’s or higher | 824 | 53 | 857 | 51 |
Ethnicity | ||||
Non-White | 192 | 12 | 220 | 13 |
White | 1376 | 88 | 1470 | 87 |
Country of birth | ||||
Born outside of the UK | 227 | 14 | 274 | 16 |
Born in the UK | 1341 | 86 | 1416 | 84 |
Has a partner | ||||
No | 484 | 31 | 519 | 31 |
Yes | 1084 | 69 | 1171 | 69 |
Has children* | ||||
No | 663 | 42 | 652 | 39 |
Yes | 905 | 58 | 1038 | 61 |
Data quality indicators | ||||
Median time spent (min) | ||||
Desktop | 42 | N/A | 44 | N/A |
Smartphone | 38 | 39 | ||
Tablet | 45 | 46 | ||
Extreme responses (all “strongly agree”)1 | ||||
Attitudinal Block 1 | 1 | 0 | 9 | 1 |
Attitudinal Block 2 | 15 | 1 | 24 | 1 |
Straightlining1 | ||||
Attitudinal Block 1 (9 items) | 9 | 1 | 19 | 1 |
Attitudinal Block 2 (4 items) | 391 | 25 | 399 | 24 |
Average item non-response | ||||
Don’t know | N/A | 3 | N/A | 3 |
Refused to answer | N/A | 1 | N/A | 1 |
Consent to future waves* | ||||
Yes | 1329 | 85 | 1381 | 82 |
No | 239 | 15 | 309 | 18 |
Time of response | ||||
After invitation letter | 674 | 43 | 701 | 41 |
After first reminder | 570 | 36 | 624 | 37 |
After second reminder | 324 | 21 | 365 | 22 |
Incentive | ||||
£15 voucher | 1425 | 91 | 1543 | 91 |
£20 voucher | 143 | 9 | 147 | 9 |
Total | 1568 | 1690 | ||
The following data quality indicators are analysed to address H4: survey length (actual time spent on survey), time of response, consent for future survey waves, item non-response (measured as the number of “don’t know” answers and refusals divided by the total number of questions answered), break-off rates, and response style behaviours such as straightlining and extreme responses in two batteries of attitudinal questions concerning intimate partnerships and parenthood, and inter-generational values.
The GGS yielded AAPOR RR3 of 14% (AAPOR, 2023). The response rate was significantly higher for the QR-with-URL letter condition (14%) compared to the URL-only letter condition (13%). Break-off rates did not significantly differ between the conditions: 9% for the URL condition and 9% for the QR-with-URL letter condition. These findings support H1, indicating a higher response rate in the QR-with-URL letter condition.
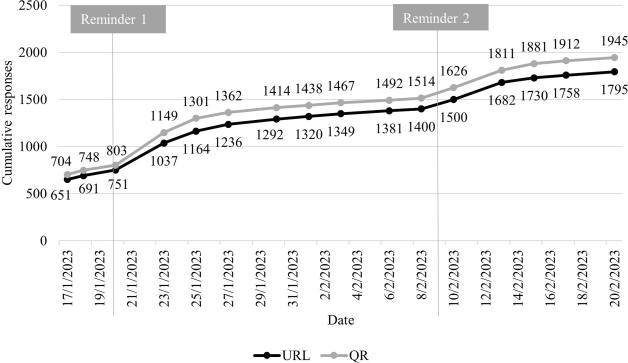
We examined the cumulative responses over time to assess whether the higher response rate in the QR-with-URL letter condition was maintained across multiple contact attempts. Fig. 2 demonstrates that the overall pattern of responses is similar across the two conditions but a relatively higher number of responses were accumulated in the QR-with-URL letter condition after the first reminder letter.
Table 1 suggests that there is a significant association between the experimental conditions and device type. Respondents in the QR-with-URL letter condition were significantly more likely to use smartphones (59%) compared to those in the URL-only letter condition (46%). This finding supports H2, indicating a higher proportion of smartphone users in the QR-with-URL letter condition.
In Table 1, chi-square tests demonstrated that the QR-with-URL letter condition resulted in significantly more completed questionnaires from respondents with children, but no other statistically significant associations with demographic characteristics were identified. These results do not support H3, which expected that the QR code would improve sample composition by attracting traditionally harder-to-survey respondents, such as younger individuals, those with lower education levels, and ethnic minorities.
The median completion time was 39 min. Smartphone respondents spent less time on the survey than those using other devices, but Mood’s median test (Mood, 1954) demonstrated no significant difference in median survey completion time by condition. Additionally, no differences were found between the two conditions for time of response, item non-response, incentive levels, or response style behaviours. The overall incidence of extreme responses was very low (< 2%), and there was no significant difference in straightlining between experimental groups. These findings contradict H4, suggesting that there are no differences in data quality between QR-with-URL and URL-only letter conditions, and that the use of QR codes on invitation letters is not associated with poorer data quality.
A surprising significant finding emerged regarding respondents’ willingness to participate in future waves by letter condition. Participants in the URL letter group were significantly more willing to take part in future waves than those who received a letter containing both a QR code and a URL. It is possible that differences in digital literacy, privacy perceptions, or device usage patterns across the two groups underlie this finding, which warrants further investigation.
The results suggest that the QR-with-URL letter condition is associated with a higher response rate compared to the URL-only letter condition and a higher likelihood of respondents using smartphones over desktops/PCs, which aligns with previous literature on QR codes (Endres et al., 2023; Harrison et al., 2019; Hupp et al., 2023; Olson & Ganshert, 2024; Patrick et al., 2022). Given that many social surveys now incorporate smartphones for additional tasks, such as geo-tracking, biometrics, time diaries, digital trace data collection, and other tasks—these results are reassuring. They suggest that QR codes included in the letters could be an effective strategy for encouraging respondents to use smartphones for survey completion.
The results also suggest no significant demographic differences between the experimental groups, which is consistent with some earlier studies (Olson & Ganshert, 2024). These results imply that QR codes included in the invitation and reminder letters may not be an effective strategy for increasing participation from harder-to-reach respondents, such as younger people, those with lower education levels, and respondents from ethnic minority groups, who are more likely to use smartphones for survey completion (Hupp et al., 2023; Leary et al., 2023; Lee et al., 2023; Mcdaniel et al., 2023). It was reassuring, however, that no differences in data quality were found between the experimental conditions, suggesting that inclusion of QR codes in the letters is a viable option to increase participation and responses via smartphones without compromising data quality. These findings are consistent with Hupp et al. (2025). However, it is important to note that GGS respondents are below 60 and this age range might influence the results. This hypothesis should be tested in the context of a general population survey. Additionally, it is important to further investigate the finding regarding respondents’ willingness to participate in future waves, as those in the QR-with-URL letter group appeared to be less willing to do so.
The main limitation of this study is its inability to differentiate between respondents who used QR codes and those who used URLs to access the survey within the QR-with-URL letter condition. Consequently, most of the analyses conducted are limited to assessing whether respondents received an invitation letter that included a QR code, rather than capturing their actual behaviour in using it. However, despite this limitation, the results of the analysis still allow for important general insights and conclusions.
Identifying respondents who accessed the survey via QR codes would enable more detailed analyses and a better understanding of QR code usage. Future survey practitioners should consider assigning unique access codes to each respondent to track how they accessed the survey or creating separate landing pages for those entering via URL and QR codes. Additional tracking enhancements could include indicators identifying whether the respondent accessed the survey through the initial invitation letter or a reminder letter.
It is strongly recommended that survey agencies ensure that variables identifying the methods of questionnaire access are available for researchers. Future studies should also clearly specify whether reported QR code effects are based on distinct access methods or merely the presence of QR codes in invitation materials, as was the case in this experiment, when more detailed access data were unavailable.
This work was supported by the ESRC grant “The Generations and Gender Survey (GGS) in the UK: Investigating demographic changes in the family and advancing online survey methodology”, grant number ES/V012770/1.
These data are deposited at Generations and Gender Project (GGP) Colectica repository (https://ggp.colectica.org/), and the UK Data Archive, where registered users can access the data (Perelli-Harris et al., 2024).
AAPOR (2023). Standard Definitions: Final dispositions of case codes and outcome rates for surveys (10th edn.). Alexandria,VA: AAPOR. Available at: https://aapor.org/wp-content/uploads/2023/05/Standards-Definitions-10th-edition.pdf a, b
Asensio, M. (2024). Integrating Smartphones in the Web Survey Data Collection Process: Challenges and Opportunities. University of Lausanne. https://iris.unil.ch/entities/publication/39dfedd2-8a3c-44dd-a3f0-1473244dfd36 →
Davies, H., Hjorth, L., Andrejevic, M., Richardson, I., & DeSouza, R. (2023). QR codes during the pandemic: Seamful quotidian placemaking. Convergence, 29(5), 1121–1135. https://doi.org/10.1177/13548565231160623 →
Endres, K., Heiden, E. O., Park, K. I., Losch, M. E., Harland, K. K., & Abbott, A. L. (2023). Experimenting with QR codes and envelope size in push-to-web survey. Journal of Survey Statistics and Methodology, 00, 1–13. https://doi.org/10.1093/jssam/smad008 a, b
Gostin, I. (2021). How The Pandemic Saved The QR Code From Extinction. https://www.forbes.com/councils/forbescommunicationscouncil/2021/03/25/how-the-pandemic-saved-the-qr-code-from-extinction/ →
Guidry, K. (2012). Response quality and demographic characteristics of respondents using a mobile device on a web-based survey. AAPOR Annual Conference. https://citeseerx.ist.psu.edu/document?repid=rep1&type=pdf&doi=a41475e57d469826d587340a962b24f81249b876 →
Harrison, S., Henderson, J., Alderdice, F., & Quigley, M. A. (2019). Methods to increase response rates to a population-based maternity survey: A comparison of two pilot studies. BMC Medical Research Methodology. https://doi.org/10.1186/s12874-019-0702-3 a, b, c
Howe, S., Maatouk, N., & Dyer, A. (2024). Generations and Gender Study UK Technical Report. https://doc.ukdataservice.ac.uk/doc/9247/mrdoc/pdf/9247_ukggs_technical_report_mar24.pdf a, b
Hupp, A. L., Schroeder, H. M., Leissou, E., & West, B. T. (2023, May). The Impact of QR Codes on Recruitment and Data Quality for a Web Screener. 78th Annual Conference of the American Association for Public Opinion. a, b, c, d
Hupp, A. L., Schroeder, H. M., West, B. T., Leissou, E., & Weir, D. R. (2025). Who Chooses a QR Code over a URL to Access a Web Screener in a National Probability Survey of Older Adults, and the Impact on Data Quality. Survey Methods: Insights from the Field (SMIF), 3, 20208. https://doi.org/10.13094/SMIF-2025-00003 →
Keusch, F., & Yan, T. (2017). Web versus mobile web: An experimental study of device effects and self-selection effects. Social Science Computer Review, 35(6), 751-769. https://doi.org/10.1177/0894439316675566 →
Leary, S., Pate, K., Schafer, B., Javaid, R., & Langetieg, P. (2023, May). Can You Drive Response with a QR Code—and Should You? An Experiment on a U.S. Government Web-Only Survey. Annual Conference of the American Association for Public Opinion Research. a, b
Lee, N., Scott, L., Prachand, N., Singh, M., & Matzke, H. (2023, May). The use of QR codes to increase rate of survey participation in a web survey. 78th Annual Conference of the American Association for Public Opinion. www.rti.org a, b
Lugtig, P., & Luiten, A. (2021). Do shorter stated survey length and inclusion of a QR code in an invitation letter lead to better response rates? | Survey Methods: Insights from the Field (SMIF). Survey Methods: Insights from the Field. https://doi.org/10.13094/SMIF-2021-00001 a, b
Lugtig, P., & Toepoel, V. (2015). The Use of PCs, Smartphones, and Tablets in a Probability-Based Panel Survey. Social Science Computer Review 34(1), 78–94. https://doi.org/10.1177/0894439315574248 →
Marlar, J. (2018). Do Quick Response Codes Enhance or Hinder Surveys? https://news.gallup.com/opinion/methodology/241808/quick-response-codes-enhance-hinder-surveys.aspx →
Marlar, J., & Schreiner, J. (2024). The Use of QR Codes to Encourage Participation in Mail Push-To-Web Surveys: An Evaluation of Experiments from 2015 and 2022. Journal of Survey Statistics and Methodology. https://doi.org/10.1093/jssam/smae024 a, b
Maslovskaya, O., Smith, P. W. F., & Durrant, G. (2024). Do respondents using smartphones produce lower quality data? Evidence from the first large-scale UK mixed-device survey—Understanding Society Wave 8. International Journal of Social Research Methodology. https://doi.org/10.1080/13645579.2024.2397474 a, b
Mavletova, A., & Couper, M. P. (2015). A Meta-Analysis of Breakoff Rates in Mobile Web Surveys. In D. Toninelli, R. Pinter & P. de Pedraza (Eds.), Mobile Research Methods: Opportunities and Challenges of Mobile Research Methodologies (pp. 81–98). Ubiquity Press. →
Mavletova, A., & Couper, M. P. (2016). Device use in web surveys: The effect of differential incentives. International Journal of Market Research, 58(4), 523–544. https://doi.org/10.2501/IJMR-2016-034 →
Mcdaniel, K., Carr, C., Jayaram, P., Suresh, R., & Guyer, H. (2023, May). Web Data Collection: Reviewing Device Preferences and the Use of QR Codes on the Mental and Substance Use Disorders Prevalence Study (MDPS). 78th Annual Conference of the American Association for Public Opinion. www.rti.org a, b
Mood, A. M. (1954). On the Asymptotic Efficiency of Certain Nonparametric Two-Sample Tests. Annals of Mathematical Statistics, 25, 514–522. https://doi.org/10.1214/aoms/1177728719. a, b
Olson, K., & Ganshert, A. (2024). Remember, You Can Complete This Survey Online! Web Survey Links and QR Codes in a Mixed-Mode Web and Mail General Population Survey. Social Science Computer Review https://doi.org/10.1177/08944393241277553 a, b, c, d
Patrick, M. E., Couper, M. P., Jang, B. J., Laetz, V., Schulenberg, J. E., O’Malley, P. M., Bachman, J., & Johnston, L. D. (2022). Building on a Sequential Mixed-Mode Research Design in the Monitoring the Future Study. Journal of Survey Statistics and Methodology, 10(1), 149–160. https://doi.org/10.1093/jssam/smaa030 a, b
Perelli-Harris, B., Maslovskaya, O., & Berrington, A. (2024). United Kingdom Generations and Gender Survey, 2022–2023: Special Licence Access. UK Data Service. https://doi.org/10.5255/UKDA-SN-9247-1 a, b
Sommer, J., Diedenhofen, B., & Musch, J. (2016). Not to Be Considered Harmful: Mobile-Device Users Do Not Spoil Data Quality in Web Surveys. Social Science Computer Review 35(3), 378–387. https://doi.org/10.1177/0894439316633452 →
Stapleton, C. E. (2013). Device effects on survey response quality. A comparison of smartphone, tablet and PC responses on a cross sectional probability sample. Survey Methods: Insights from the Field (SMIF). https://surveyinsights.org/?p=13585 a, b
Struminskaya, B., Weyandt, K., & Bosnjak, M. (2015). The Effects of Questionnaire Completion Using Mobile Devices on Data Quality. Evidence from a Probability-based General Population Panel. Methods, Data, Analyses, 9(2), 32. https://doi.org/10.12758/MDA.2015.014 a, b