The online version of this article (https://doi.org/10.18148/srm/2026.v20i2.8504) contains supplementary material.
Postal surveys are a traditional and routinely used delivery method for population surveys (Dillman, Smyth & Christian, 2014, 351–397). The main advantage of this method is, self-evidently, that (almost) everyone has or should have a postal address and thus can be reached by the original sampling. This method therefore does remain quite popular among researchers (Ernst et al., 2018). This approach sets this method apart from opt-in internet panels (Cornesse et al., 2022; Pentzek et al., 2022). Throughout society, however, it can be observed that postal services have become less ubiquitous. In France, e.g., the central Post Office estimates that the total number of letters that are being sent by family households, has shrunk from 1.2 billion in 2010 to a mere 150 mio. in 2020 (La Poste, 2022).
Inevitably, this also renders it more difficult to conduct postal surveys in an effective and valid manner. In numerous countries, the offer of drop-off letterboxes has been decimated, with as a result that it has become more difficult for respondents to return their questionnaires. A way to maintain the relevance of postal surveys is a ‘push to the web’ strategy, where respondents are actively encouraged to answer by means of an online survey tool. While this kind of technique is widely used by commercial survey companies, academic survey researchers are rather hesitant to take this step, as it is assumed that web surveys are mainly attractive for younger, highly-educated urbanites (de Clercq, D’Haese & Buysse, 2023; Tolpadi et al., 2024). Here we are confronted with the typical phenomenon of a ‘digital divide’ within society, where some groups have easy access to internet services and others do not, but there is not much empirical evidence about the contemporary relevance of this concept (Lythreatis, Singh, & El-Kassar, 2022). Especially with regard to age, it can be assumed that this digital divide is present, with older age groups still being more reluctant to use the internet for various purposes in their daily lives (Leukel, Schehl, & Sugumaran, 2021). We are confronted, therefore, with a conundrum. On the one hand, postal surveys do maintain their appeal, as they offer a unique manner to reach out to the almost universal population (Gooden et al., 2021). On the other hand, we are confronted with declining response rates in most major comparative postal surveys (Jabkowski & Cichocki, 2025).
A way to reach out to respondents that are typically not very prone to use webtools, is to offer a mixed-mode strategy, where respondents are offered the possibility of either answering on paper or via a webtool (Greenlaw & Brown-Welty, 2009; Wolf et al., 2021; Heimel, Medway & Horwitz, 2024). Mixed-mode strategies lead to higher response rates than relying exclusively on postal or web-based surveys (Greenlaw & Brown-Welty, 2009). The expectation is that while younger respondents will find the webtool more convenient and attractive, for older generations a paper questionnaire remains to be preferred (Bech & Kristensen, 2009; Medway & Fulton, 2012). In this study we report on two election surveys that were conducted in Belgium, with five years in-between: in 2019 and 2024. During those five years, internet continued to become more prevalent in the daily lives of most citizens, and the expectation therefore is that online responses too have become mainstreamed. To the extent that a larger proportion of the population uses the internet daily, the expectation is that traditional forms of bias or stratification have been weakened (Calderwood et al., 2023). This was especially the case because during the Covid-19 pandemic schools and workplaces massively switched to online services, with as a result that most Belgian households had to be connected to the internet in order to function in a more or less normal manner. It is estimated that while in 2019, 90% of all Belgian households had a broadband internet connection, this was 95% in 2024 (Statbel, 2024a).
This proliferation also had an effect on the election surveys in the country: while in 2019, 13% of all respondents opted for an online response, this proportion doubled to 26% in 2024.1 This trend has important consequences for survey researchers. On the one hand, it could be argued that given the fact that internet access is by now almost universal in Belgium, postal surveys have become obsolete. On the other hand, we do know that while basically everyone has access to the internet by now, a strong stratification does remain with regard to the likelihood to use the web for all kinds of purposes (Heikkilä, Leguina, & Purhonen, 2020). Furthermore, while paper responses entail costs for the research team (postage and coding), this cost is lower for online responses (Olson et al., 2021; Olson et al., forthcoming). However, relying exclusively on web-only survey designs is associated with a lower response rate (Brown et al., 2018). As an alternative, therefore, mixed-methods surveys lead to higher response rates, but they come with the caveat that they can be more expensive than single-mode studies (Greenlaw & Brown-Welty, 2009).
In this study, we briefly review the evidence with regard to implementing a postal survey with the option to answer either in writing, or online, based on the experience of two population surveys in Belgium, with five years apart. The comparison between both surveys suggests few significant differences in the determinants of online or paper responses. We do find a remarkable difference regarding age, however: although the difference in effect between the surveys is not significant, we find a linear gradient for age in 2019 and a non-linear association in 2024, with mostly the older cohorts preferring the paper option to a very large extent. We suggest therefore that if the goal is to reach out to an older age group, the pen and paper option still should be offered to potential respondents.
Postal and face-to-face surveys have traditionally been the most often used survey methods (Dillman, Smyth & Christian, 2014). The main advantage of using a postal invitation is that, in principle, in the countries that have a Napoleon-inspired system of national records, each and every legal inhabitant of the country has an address. As Belgium was part of France between 1795 and 1815, this system of national records has been implemented ever since, and it offers a universal coverage of all legal inhabitants in the country, who are allowed to have only one legal address.2 In countries that do not have a central population register, this advantage of a post based sampling design might indeed be less convincing. Nevertheless, the same kind of universal sampling cannot be attained if potential respondents are recruited by other means such as their email address: not everyone has such an address, other people can have numerous addresses, and obviously there is no valid register of all email addresses in a country.
It is clear that each type of survey mode—face-to-face, telephone, web, or paper—comes with its own set of limitations. Traditional approaches like face-to-face or mail surveys are often too expensive or are too time-consuming. At the same time, newer modes such as web surveys also tend to have lower response rates than other methods (Daikeler et al., 2022; Brown et al., 2018). In response to these developments, researchers have increasingly adopted mixed-mode survey designs, which combine different data collection methods to maximise response rates and maintain data quality (Wolf et al., 2021). Within mixed-mode designs, there are two types, concurrent and sequential (DeLeeuw, 2018). In a concurrent design respondents receive all available survey modes from the first contact. In a sequential design, only one mode is presented initially, usually the least expensive, such as web mode. The other modes are provided in the reminders. Sequential web-push designs may be less effective for achieving high response rates, as individuals who prefer another mode or lack web access may decline the initial invitation and ignore following reminders (Asimov & Blohm, 2024).
In this study, we use a concurrent mixed-mode design, which maximises the response rate by reducing the risk of non-response among those unable or unwilling to use the web mode. This approach also helps to reach a more diverse set of respondents, increasing overall participation (Asimov & Blohm, 2024). Although mixed-mode designs hence offer various advantages, it should be noted that this method entails additional costs as well. The overall average cost for mixed-mode designs is almost the same or sometimes even higher than single mode studies (Olson et al., forthcoming; Greenlaw & Brown-Welty, 2009). The main rationale behind mixed-mode designs is that a sizable proportion of the population remains either unable or unwilling to participate in purely web-based surveys (Daikeler et al., 2025). Offering an alternative mode, such as mail, alongside a web option can help mobilize these respondents. Thus, the main advantage of this kind of mixed-mode survey is that inviting potential respondents by mail enables researchers to have a valid sampling method, while the written invitation can include the option to answer on paper (usually by including a stamped envelope for returning the questionnaire), or to answer online. Offering an online response option offers respondents a contemporary and easy-to-use answering tool. There is no reason to assume that this strategy would always function in the same manner, as internet use and mobile devices continue to proliferate, while technological advances facilitate the use of those tools. Furthermore, it is important to note that using mixed-mode designs—in which web and paper surveys are offered simultaneously—also involves certain trade-offs. Higher participation through mail increases costs due to the need for manual data entry, and paper surveys limit the ability to implement complex, adaptive survey designs, such as dynamic question paths. Nevertheless, overall, mixed-mode surveys present a promising, cost-efficient alternative to traditional face-to-face surveys, especially in contexts where achieving high response rates is challenging and financial or logistical constraints are present.
Evidence from Germany illustrates the effectiveness of self-administered mixed-mode surveys. Wolf et al. (2021) demonstrate that combining web and mail options offers a viable alternative for large-scale general population surveys and can successfully replace traditional face-to-face surveys, such as General Social Survey (GSS)-type studies. Their findings show that self-administered mixed-mode surveys achieved higher response rates than face-to-face surveys while simultaneously reducing costs. Furthermore, the fieldwork periods were considerably shorter compared to face-to-face surveys. Other research indicates that there are no significant differences between respondents that prefer to answer on paper, and those that prefer to answer online (Calderwood et al., 2023). In this specific study, gender and ethnicity did not have strong effects on the way respondents reacted to the options being offered. A major limitation of this study, however, is that the sampling was limited to young adults with an age of 25 (Calderwood et al., 2023, 150). Another study on this topic, too, remained limited to respondents younger than 60 (Patrick et al., 2022). As we know there is a strong age effect on the digital divide, self-evidently this strongly limits the possibility that the findings of this single study could be generalized toward the total population. It is important, therefore, to assess to what extent such a ‘push to the web’ strategy, offered in a postal survey, might lead to bias in a general population study. Did the proliferation of internet access in recent years lead to the mainstreaming of internet answers among potential respondents? That is the main question guiding our analysis.
Our study is based on the results of two election surveys that were conducted on the occasion of general elections in Belgium, in 2019 and 2024 (Stiers, Hooghe, De Grauwe, & Voets, 2025).3 In both cases, the research team used a similar design, where potential respondents were first contacted by mail, and in the letter they received the option to answer using pen and paper, or by using the online tool. Both surveys were conducted in an identical manner, by the same research team. The response rate was 23% in 2019 (resulting in 1814 respondents), and 21% in 2024 (resulting in 2005 respondents). In both surveys, the sampling was based on the National Register of the Belgian Ministry of the Interior, and a special permission was granted by the Minister of the Interior. The only exception is that in 2019, the GDPR guidelines on privacy had just become enforced, with as a result that the Ministry was still extremely cautious and allowed only one reminder to be sent (Minister of the Interior, 2019). As in 2024, there was already more experience with implementing GDPR rules, the Minister allowed to send out two reminders (Minister of the Interior, 2024). This might have influenced the results as the first of the two reminders in 2024 consisted of a one-page letter wherein respondents were invited to either complete the questionnaire they received some weeks before, or to fill it out online. The second reminder consisted again of a full paper questionnaire, which is equivalent to the single reminder in 2019.4 As this was an election study, the sampling was limited to Belgian citizens who had voting rights. This implied a minimum of 18, and the team also set a maximum age of 85. Potential respondents received a 24 page questionnaire, mostly with validated scales on political attitudes. The only material incentive was that respondents could select a charity, and the research team subsequently paid a small amount to that specific charity. The potential respondents received an envelope with a ‘Postal Response’ system, so that returning the paper questionnaire did not entail any cost for the respondent.
We start the analysis by simply presenting the demographic characteristics of the two groups of respondents. The most relevant variables in this regard all refer to the traditional divisions that are associated with a “digital divide” (Campos-Castillo, 2015): age (young people more online), gender (males more online), education level (higher educated more online) and level of urbanization (more in cities). Gender is coded binary, with 0 indicating male and 1 female. Age is calculated as the age in the election year. We also include its squared term to test for non-linear effects. Educational level is measured using the 9‑point ISCED scale.5 As this is measured in exactly the same manner in both survey years, we include the full scale in the analyses. Finally, respondents were asked to assess the urbanization of their place of living, and they could indicate this on a scale ranging from 1 (“rural area or village”) over 2 (“small or mid-sized town”) and 3 („city with less than 100.000 inhabitants”) to 4 (“large city with more than 100.000 inhabitants”).
Interestingly, households in the Flemish region of Belgium have internet access more often than households in the Walloon region of the country (Statbel, 2024a). This can be explained by higher average income levels, a higher population density and a more competitive market for internet providers. While the average income in the Flemish region is €21,776 in 2021, this is €19,192 for the Walloon region (Statbel, 2023), and this different level of economic development apparently also leads to differences with regard to internet access and use. We therefore include income, which is measured as the total household income after taxes.6 Respondents could indicate their income on a scale consisting of categories spanning ca. €1000 each.7 As these categories differed somewhat between survey years (i.e., seven categories were presented in 2019 while an 8th, higher, category was included in 2024 in order to keep track of inflation), we rescale this variable so that it ranges from 0 to 1.8 Furthermore, as an additional test, we will distinguish the patterns we find in both major regions of the country.
Besides these socio-demographic indicators, we include standard political attitudes that have been shown to correlate strongly with taking part in surveys (Wu, Zhao & Fils-Aime, 2022). To this end, we include political interest, probed as a self-reported scale ranging from 0 (“not interested at all”) to 3 (“Very much interested”), and political knowledge, measured as the number of correct responses on four factual knowledge questions.9 As a last attitude, to test whether respondents differ in their political leaning, we include a self-reported position on the ideological left-right continuum, where 0 indicates left-wing, 5 a centrist, and 10 a right-wing position.
Finally, Belgium too has been confronted with a retrenchment of public service provision. This has meant that, e.g. the Post Office has diminished the number of letterboxes that citizens can use to deposit their mail. It can be expected that especially in rural areas, potential respondents will now be forced to travel considerable distances to be able to use such a letterbox, and therefore we also include the presence of letterboxes in the municipality of the respondent, expressed in the offer of letterboxes per square kilometre. These data were compiled by combining data from the Post Office (BPost, 2024) and the National Institute for Statistics (Statbel, 2024b). Furthermore, we include an objective measure of urbanization with an indicator of population density of the municipality. Note that we can only estimate analyses including municipality-level variables for the year 2024. As was mentioned, GDPR rules were interpreted very strictly in 2019, and for privacy concerns the research team was not allowed to ask in what municipality the respondent resides. Therefore we only have access to individual level data for the 2019 sample. By 2024, however, a slightly more lenient interpretation of GDPR rules prevailed, so we can actually include characteristics of the municipality of the respondent for the 2024 analysis.
First we offer bivariate tests (Table 1) to assess in a clear manner how the answering options have changed between 2019 and 2024—and later we will test whether these changes are significant or not. With regard to gender, there seems to be difference between the two observation years. In 2019, the online sample only included 36% women, while this was 47% in 2024. While still statistically significant, the gender difference is substantially very small. For age, however, we can observe exactly the opposite phenomenon. While the difference in average age between the paper and the online sample was eight years in 2019, this became almost a full 13 years in 2024. The results further suggest that differences in education level and income weakened somewhat, but they are significant in both years. These effects have to be interpreted with caution, however, given the more general phenomenon of survey participation bias as a result of educational stratification (Stein et al., forthcoming). For the attitudinal variables, the 2019 differences all lost their significance in the 2024 sample, and urbanization is not significant in any of the two years. Interestingly, the difference between Flanders and Wallonia becomes negligible in terms of size, and is also rendered non-significant.
Table 1 Bivariate tests
2019 | 2024 | |||||
Online | Paper | Difference | Online | Paper | Difference | |
Entries are mean scores on the respective scales on which the variables were measures; see Appendix A for a full list of the variables and how they were measured *p < 0.05; **p < 0.01; ***p < 0.001. | ||||||
Gender (1 = female) | 0.356 | 0.506 | 0.150*** | 0.466 | 0.524 | 0.058* |
Age | 44.745 | 53.203 | 8.458*** | 45.267 | 57.969 | 12.701*** |
Educational level | 6.309 | 5.378 | −0.932*** | 6.361 | 5.588 | −0.773*** |
Income | 0.646 | 0.505 | −0.141*** | 0.629 | 0.536 | −0.093*** |
Political interest | 1.911 | 1.726 | −0.185** | 1.829 | 1.820 | 0.009 |
Political knowledge | 2.445 | 2.202 | −0.243** | 2.380 | 2.302 | −0.078 |
Left-right ideology | 5.288 | 5.299 | 0.011 | 5.365 | 5.614 | 0.249 |
Urbanization | 1.894 | 1.843 | −0.052 | 1.873 | 1.802 | 0.071 |
Region (Wallonia = 1) | 0.314 | 0.416 | 0.102** | 0.430 | 0.476 | 0.046 |
These results show the significance of the differences within year, not whether the differences between years are significant. To test for this, we estimated regression models including each time the year of survey and the respective variable of interest, as well as the interaction of these two variables. The results, reported in Appendix G, show that some of the differences between respondents answering online and on paper change significantly. However, these models only include each time one variable of interest, while they could act as confounding factors for each other. Therefore, as a next step in the analysis, we report the results of multivariable models, to examine which factors are decisive in explaining survey response mode. The dependent variable indicates whether a respondent took the survey on paper (value 1) or online (value 0). As this is a dichotomous measure, we report the results of logistic regression models in Table 2. The results lead to the same conclusions as those drawn above: female respondents are more likely to respond on paper. Furthermore, respondents with a higher income and respondents with more political knowledge, are more likely to answer online. Interestingly, we do not find evidence of effects for the number of letterboxes in the area of the respondent, nor of population density.10 Our expectation that the retrenchment of postal services has had a negative effect on the likelihood to answer on paper, did not receive support. It is clear, therefore, that the observed differences between 2019 and 2024 are not the result of the retrenchment of postal services in the country.
Table 2 Logistic regression models explaining survey response mode (1 = paper response)
Model 1 (2019) | 2024 | |||||
Model 2 | Model 3 (multilevel) | |||||
Coef. | Std. Err. | Coef. | Std. Err. | Coef. | Std. Err. | |
Entries are logit coefficients, standard errors in parentheses. Data source: CSES Belgium, 2019, 2024. See Appendix A for details on the measurement of all variables *p < 0.05; **p < 0.01; *** p < 0.001. | ||||||
Female | 0.659*** | 0.170 | 0.393** | 0.124 | 0.393** | 0.124 |
Age | 0.017 | 0.032 | −0.037 | 0.024 | −0.036 | 0.024 |
Age2 | 0.000 | 0.000 | 0.001** | 0.000 | 0.001** | 0.000 |
Educational level | −0.082 | 0.051 | −0.095* | 0.040 | −0.093* | 0.040 |
Income | −1.459*** | 0.367 | −0.415 | 0.277 | −0.417 | 0.277 |
Political interest | −0.152 | 0.116 | −0.003 | 0.086 | −0.002 | 0.086 |
Political knowledge | −0.096 | 0.076 | −0.226*** | 0.060 | −0.233*** | 0.060 |
Left-right ideology | 0.013 | 0.036 | 0.029 | 0.026 | 0.028 | 0.026 |
Urbanization | −0.013 | 0.085 | −0.000 | 0.065 | 0.079 | 0.084 |
Region: Wallonia | 0.474** | 0.174 | 0.156 | 0.123 | 0.167 | 0.128 |
Population density | – | – | – | – | −0.012 | 0.027 |
Relative number of letterboxes | – | – | – | – | −10.019 | 48.398 |
Constant | 2.046* | 0.828 | 1.684** | 0.607 | 1.674** | 0.611 |
N (individuals) | 1500 | 1689 | 1688 | |||
N (municipalities) | – | – | 465 | |||
Pseudo R2 | 0.096 | 0.107 | – | |||
Var. (municipalities) | – | – | 0.000 | |||
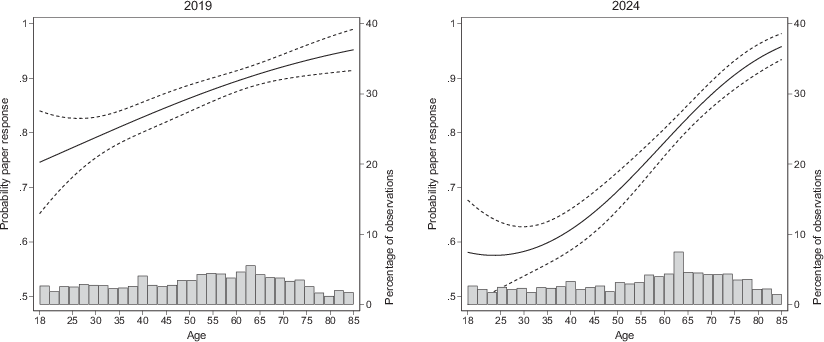
As a rather peculiar result, when looking at age, in 2024 we find a significant non-linear effect on answering on paper. The effects are not significant in 2019, but do note that the linear effect is significant if age2 is not included in the model. To compare these two effects in more detail, and to interpret the results substantively, we show the predicted probability of answering on paper at different ages for both survey years in Fig. 1.
The results in Fig. 1 further support the conclusion that in 2019 there was a linear effect of age on answering the paper survey, whereas this was non-linear in 2024. In the latter year, respondents ages 18 until ca. 40 answered on paper to the same extent, but from this age on there is a strong and linear increase in proportion of paper responses by age. Among the respondents up to 40 years old, about 58% took the survey on paper; among the oldest respondents, more than 90% answered the paper version of the questionnaire. It is therefore clear that, when given the choice, older respondents strongly prefer taking paper surveys.
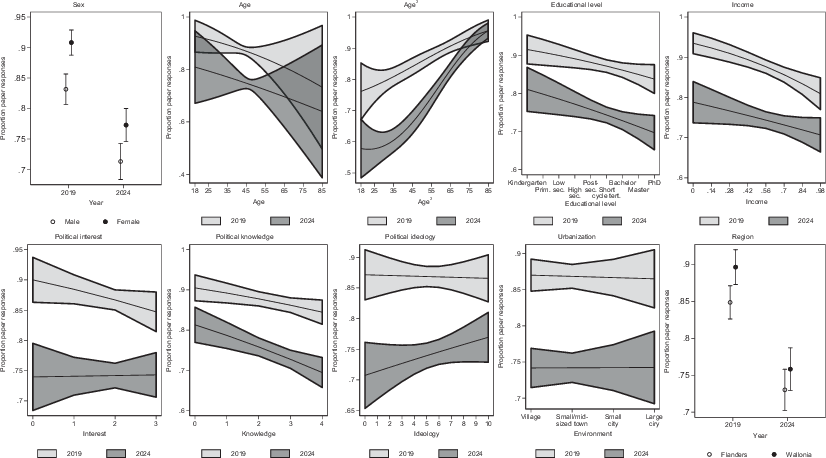
To ascertain whether the changes in the differences between years that we observed in Table 1 are significant, we estimate our models again, this time including interactions between the survey year and the different variables of interest respectively. We hence pool the data of the two years, allowing to interact each variable with the indicator of survey year.11 As the additional of municipality-level variables did not make much difference for 2024, we focus on the individual-level data. To make the results easier to interpret, we calculate the predicted probability of a paper response for the full scales of our variables of interest in both years respectively, which we display in Fig. 2.12 The full results of the regression models, are summarised in Appendix E.
The results in Table E.1 and Fig. 2 further confirm that there are structural patterns in who answers on paper or online. However, when it comes to changes in effects between the surveys, we find almost no evidence for different effects between the years. We only find a significant interaction effect for income, showing that the effect of income is significantly smaller in 2024 than it was in 2019. For the other variables, however, there is no evidence for significant interaction effects. In general, therefore, there is either not much evidence for any effects, and certainly not for differences in the effects between the survey years.
We do observe an interesting pattern with regard to age, as the estimate of the linear effect of age is similar in both years while we found a non-linear pattern in 2024 specifically (Fig. 1). The interaction is also not significant, showing that, with regard to age, the stratification did not become smaller during the observation period. We have to acknowledge that the age difference did not become significantly stronger, but as our expectation was that it would become weaker, this hypothesis clearly does not receive support. Hence, whereas a larger share of online responses decreases biases in survey response, it does not decrease the bias in terms of age. Furthermore: the structure of the bias seems to have changed between both observations. While the effect in 2019 was linear, it has become curvilinear in 2024. While this obviously calls for further research, an intuitive interpretation might be that we are observing a kind of cohort effect, where the group that was born before ca. 1985 continues to have a strong preference for paper answers.
As can be observed, the ratio of postal and online responses in a mixed-mode survey changed dramatically during a five-year observation period. The question we wanted to answer, however, is whether this mainstreaming process also has led to a reduction of the bias that was typically found in internet use. As we could rely on a general population survey, the answer to that question seems more qualified than in some of the earlier research on this question. In general, we did not find evidence for different stratification patterns between the years. There are two exceptions to this. First, while there was a significant income-based bias in response mode in the 2019 survey, this disappeared in 2024, and the effect of income was indeed significantly reduced. Second, our results point to an interesting pattern with regard to age. It seems clear that there is a rather strong group of older respondents who continue to prefer answering using the traditional paper format. The Belgian results, in this regard, are distinct from the results of an earlier study on this topic in Germany (Wolf et al., 2021, 638). This is an important finding, as we know that this older age group has distinct attitudes and value patterns, and the risk of resorting to online recruitment is that the prevalence of these patterns will be underestimated. As a limitation, it has to be noted that this mixed-mode survey offered a free choice between the web and the paper answer option. In other surveys, researchers tend to follow a ‘push to the web’ strategy, where potential respondents are actively encouraged to answer by using a web option. Still other surveys only offer a web-based answering option. Given the current research results, there is a clear risk that these strategies might lead to an underrepresentation of older respondents, a topic that has not been fully addressed in earlier research (Wolf et al., 2021). To what extent this risk does in fact occur when the web option is strongly encouraged, is a question that cannot be addressed with the current data, and this is a topic for future research.
A further limitation of the current analysis is that we only focused on representativeness of the survey population. Selecting a survey mode will entail other consequences, like item non-response, attentiveness of respondents, data quality, and cost considerations, but these elements clearly fall outside the scope of the current analysis. It can be assumed that survey researchers are well aware about all these potential trade-offs. Our recommendation for future studies, therefore, remains that if one wants to achieve a good degree of representativeness, especially for older age groups, it does remain important to continue to offer a more traditional paper and pencil option. When given a free choice, it is clear that for older respondents, the paper option is preferred, as they tend to avoid the web based answering option. For this cohort, at least, one can observe that old habits apparently die hard.
The authors wish to thank the FWO-Flanders Research Agency for its generous support for this survey (Project G0C7122N on Electoral Accountability) and dr. Stiers also acknowledges the Senior Postdoctoral Fellowship he received from the FWO-Flanders Research Agency (project 12A1Z24N). The authors also acknowledge the key role of Ms. Greet Louw, in her meticulous attention for the fieldwork of this survey.
Asimov, A., & Blohm, M. (2024). Sequential and concurrent mixed-mode designs. A tailored approach. Journal of Survey Statistics and Methodology, 12(3), 558–577. a, b
Bech, M., & Kristensen, M. (2009). Differential response rates in postal and web-based surveys in older respondents. Survey Research Methods, 3(1), 1–6. →
BPost (2024). Trouver une boîte aux lettres rouge. Bruxelles: Bpost. →
Brown, E. M., Olson, L. T., Farrelly, M. C., Nonnemaker, J. M., Battles, H., & Hampton, J. (2018). Comparing response rates, costs, and tobacco-related outcomes across phone, mail, and Online surveys. Survey Practice, 11(2), 1–18. a, b
Calderwood, L., et al. (2023). Effects of a time-limited push-to-web incentive in a mixed-mode longitudinal study of young adults. Survey Research Methods, 17(2), 147–157. a, b, c
Campos-Castillo, C. (2015). Revisiting the first-level digital divide in the United States. Social Science Computer Review, 33(4), 423–439. →
de Clercq, M., D’Haese, M., & Buysse, J. (2023). Economic growth and broadband access. The European urban-rural digital divide. Telecommunications Policy, 47(6), 102579. →
Cornesse, C., Felderer, B., Fikel, M., Krieger, U., & Blom, A. (2022). Recruiting a probability-based Online panel via postal mail: experimental evidence. Social Science Computer Review, 40(5), 1259–1284. →
Daikeler, J., Silber, H., & Bošnjak, M. (2022). A meta-analysis of how country-level factors affect web survey response rates. International Journal of Market Research, 64(3), 306–333. →
Daikeler, J., Rossmann, J., Bretschi, D., Gummer, T., & Silber, H. (2025). Instructed response item attention checks in mixed-mode questionnaires: evidence from a probability-based mail and Online panel. Field Methods, 37(3), 228–243. →
DeLeeuw, E. D. (2018). Mixed-mode: past, present, and future. Survey Research Methods, 12(2), 75–89. →
Dillman, D., Smyth, J., & Christian, L. (2014). Internet, phone, mail, and mixed-mode surveys. Hoboken: Wiley. a, b
Ernst, S., Brand, T., Lhachimi, S., & Zeeb, H. (2018). Combining Internet-based and postal survey methods in a survey among gynaecologists. Health Services Research, 53(2), 879–895. →
Gooden, T., Wright, A., Swinn, E., & Sizmur, S. (2021). Optimising response rates in a national postal survey evaluating community mental health care. Four interventions trialled. Journal of Mental Health, 32(1), 96–102. →
Greenlaw, C., & Brown-Welty, S. (2009). A comparison of web-based and paper-based survey methods. Testing assumptions of survey mode and response cost. Evaluation Review, 33(5), 464–480. a, b, c, d
Heikkilä, R., Leguina, A., & Purhonen, S. (2020). The stratification of media usage in Finland, 2007–2018. Signs of socio-political polarization? New Media & Society, 24(5), 1053–1075. →
Heimel, S., Medway, R., & Horwitz, R. (2024). Should we offer web, paper, or both? A comparison of single- and mixed-response mode treatments in a mail survey. Journal of Survey Statistics and Methodology, 12(3), 593–623. →
Jabkowski, P., & Cichocki, P. (2025). Survey Response Rates in European comparative surveys. A 20-year decline irrespective of sampling frames or survey modes. Quality and Quantity, 59(S1), 635–655. →
La Poste (2022). Rapport Annuel. Paris: La Poste Groupe. →
Leukel, J., Schehl, B., & Sugumaran, V. (2021). Digital inequality among older adults. Explaining differences in the breadth of Internet use. Information, Communication & Society, 26(1), 139–154. →
Lythreatis, S., Singh, S., & El-Kassar, A. (2022). The digital divide. A review and future research agenda. Technological Forecasting and Social Change, 175, 121359. →
Medway, R., & Fulton, J. (2012). When more gets you less. A meta-analysis of the effect of concurrent web options on mail survey response rates. Public Opinion Quarterly, 76(4), 733–746. →
Minister of the Interior (2019). Ministerial decision on election survey. Brussels: Ministry of the Interior. →
Minister of the Interior (2024). Ministerial decision on election survey. Brussels: Ministry of the Interior. →
Olson, K., Wagner, J., & Anderson, R. (2021). Survey Costs. Where are we and what is the way forward? Journal of Survey Statistics and Methodology, 9(5), 921–942. →
Patrick, M., et al. (2022). Comparison of a Web-push vs. Mailed survey protocol in the Monitoring the Future panel Study among adults ages 35 to 60. Drug and Alcohol Dependence Reports, 4, 100089. →
Pentzek, M., Baumgart, V., & Hegerath, F.-M. (2022). Survey participation among general practitioners. Comparison between teaching physicians and a random sample. BMC Research Notes, 15, 9. →
Statbel (2023). Average Income in Belgium. Brussels: Statistical Office of Belgium. →
Statbel (2024a). ICT usage by households. Brussels: Statistical Office of Belgium. a, b
Statbel (2024b). Population by place of residence, nationality, marital status, age and sex. Brussels: Statistical Office of Belgium. →
Stiers, D., Hooghe, M., De Grauwe, C., & Voets, A. (2025). Replication data for: online answers to a postal survey. A comparison of election surveys in Belgium, 2019–2024. Harvard Dataverse. https://doi.org/10.7910/DVN/MEXG8X. →
Tolpadi, A., et al. (2024). Effects of a web–mail mode on response rates and responses to a care experience survey: results of a randomized experiment. Journal of Survey Statistics and Methodology, 12(3), 624–650. →
Wolf, C., Christmann, P., Gummer, T., Schnaudt, C., & Verhoeven, S. (2021). Conducting general social surveys as self-administered mixed-mode surveys. Public Opinion Quarterly, 85(2), 623–648. a, b, c, d, e
Wu, M., Zhao, K., & Fils-Aime, F. (2022). Response rates of Online surveys in published research. A meta-analysis. Computers in Human Behavior Reports, 7, 100206. →