It is well documented in the survey literature that incentives are effective in improving response rates to surveys in all modes (Church, 1993; Singer & Ye, 2013; Mercer et al., 2015). In particular, offering a prepaid incentive during survey invitation is more effective than not offering an incentive at all or offering a promised incentive contingent on completing the survey (Singer & Ye, 2013; Mercer et al., 2015; Blohm & Koch, 2021). Monetary incentives (e.g., cash) are more effective than non-monetary incentives (Church 1993; Singer & Ye, 2013). However, several changes during the last decade may have an impact on the effectiveness of incentives to encourage survey response.
First, multimode surveys are on the rise due to declining response rates and increasing costs of data collection (AAPOR, 2019). Guidelines on designing multimode surveys (Dillman, Smyth, & Christian, 2014) recommend using multiple modes to contact sampled persons to increase the likelihood that contacts are received and attended to by them. Dillman and colleagues (2014) further recommend including a second cash (prepaid) incentive in a later contact to improve response rates. The idea is to encourage sampled people to attend to later communication materials and to increase the chance that they comply with the survey request.
Second, many people are making online purchases and using digital payments nowadays in their everyday life. For example, Amazon has over 300 million active users in 2022 and about 157 million Prime subscribers (https://www.investing.com/academy/statistics/amazon-facts/). In addition, 89% of Americans are now using some sort of digital payments according to one U.S. digital payments statistic (McKinsey & Company, 2022). Given these trends, it is time to reevaluate the impact of other forms of incentives other than cash on response rates.
We extend the literature on incentives by experimentally evaluating the use of an electronic gift card (specifically, an Amazon.com Gift Card) as the incentive and the impact of splitting an initial incentive of $5 to a combination of an initial incentive of $2 and a second incentive of $3 on response rate, sample composition, nonresponse bias in selected survey variables, and cost per complete.
We aim to answer the following two research questions:
What is the impact of offering an incentive in the form of an electronic gift card (vs. cash) on response rate, sample composition, nonresponse bias in selected survey variables, and cost per completed interview?
What is the impact of offering an initial incentive of $2 and a second incentive of $3 (vs. one initial incentive of $5) on response rate, sample composition, nonresponse bias in selected survey variables, and cost per completed interview?
In addition to cash and checks, surveys have used other forms of monetary incentives including vouchers (Becker et al., 2019), debit cards (Gatney et al. 2009; McGrath, 2006), physical gift cards (Agarwal et al., 2016; Robbins & Hawes-Dawson, 2020), electronic gift cards such as Amazon.com Gift Cards (Avery-Desmarais et al., 2022; Birnholtz et al., 2004; Chen et al., 2016; Coopersmith et al., 2016; Ichimiya et al., 2023; Lederer, 2020; Neal et al., 2020; Smith et al., 2019), and digital payment through Paypal (Bosnjak & Tuten 2003) or mobile pay applications such as Venmo, Apple Pay and so on (Neman et al., 2022). These different forms of incentives were used both as a prepaid incentive and a promised incentive contingent upon survey completion.
Even though incentives are assumed to invoke the same reciprocity mechanism in respondents regardless of format, it is not clear which form of incentives is the most effective to increase response rates in today’s environment. On the one hand, cash is expected to have a larger impact on response rate because cash can be used anywhere and by anyone and can be used immediately once received. On the other hand, electronic gift cards and digital payment have the benefit of instant gratification because they can be delivered and made available instantly with no waiting period typically associated with the processing and mailing of cash, checks, and physical gift cards. The benefit of instant gratification is strengthened when electronic gift cards and digital payments are offered as promised incentives and when they are delivered at the end of a web survey, via emails, and/or text messages. The empirical evidence comparing the efficacy of electronic gift cards versus cash is scarce and mixed. Birnholtz and colleagues (2004) found that mailed cash prepaid incentives led to a higher response rate than prepaid Amazon.com Gift Cards among a group of engineers involved in academic research but Robbins and Hawes-Dawson (2020) reported higher response rates for Amazon.com Gift Cards than for mailed cash and physical gift cards as a promised incentive when recruiting teachers. The mixed findings indicate that the impact of electronic gift cards and digital payments (vs cash) might depend on the design of the study.
Furthermore, given the increasing use of digital payment and increasing purchases online, it is possible that electronic gift cards and digital payment may be preferred by respondents over traditional forms of incentives such as cash. Again, empirical evidence is scarce and mixed. Brown and colleagues (2016) found that adult patients who completed their web survey preferred cash than electronic gift cards from Target but a newer study reported a much higher preference for digital payment than cash among their respondents, who were current or former interviewers associated with a survey center (Neman et al., 2022). Furthermore, Lederer (2020) showed differential preference for electronic gift cards; their college respondents preferred Amazon.com Gift Cards and electronic gift cards to a popular coffee chain than electronic gift cards to a sandwich shop.
Neman and colleagues (2022) advocated the use of electronic gift cards and digital payment as incentives for web surveys due to cost efficiency and ease of distribution. Both Brown and colleagues (2016) and Robbins and Hawes-Dawson (2020) provided evidence of the cost efficiency of electronic gift cards over cash.
However, one potential concern about using electronic gift cards or digital payment as incentives is their impact on sample composition. It is possible that younger respondents and respondents with higher income are more likely to be attracted to electronic gift cards and digital payment (Pew Research Center, 2022). We haven’t found any empirical research investigating the impact of electronic gift cards incentives on sample composition and nonresponse bias.
We contributed to the literature on incentives by experimentally testing two forms of incentives. A random half of respondents were offered prepaid incentives in the form of an electronic gift card (Amazon.com Gift Card) whereas the other half received cash incentives in the mail. We compare the impact of electronic gift cards (vs. cash) on response rate, sample composition, nonresponse bias in selected survey variables, and cost per completed interview.
Research on the use of second incentives is on the rise. The second incentive is a prepaid incentive provided at a later stage of data collection to all sampled members who haven’t completed the survey yet by the time when second incentives are offered. Second incentives have been used for surveys of various modes. For instance, a second incentive was offered to sampled persons who refused to participate in a random digit dial survey as a refusal conversion strategy (Brick, Montaquila, Hagedorn, Roth, & Chapman, 2005). Brick and colleagues (2005) found that the use of a $2 second incentive (in addition to an initial incentive of $2) increased the overall screener response rate by 1.2 percentage points when respondent materials were sent by first class. However, when respondents were sent materials by Priority mailing, the second incentive of $2 didn’t affect the overall response rate.
Three studies experimented with the use of a second incentive in a sequential web-then-mail survey design (Messer & Dillman, 2011; Wagner et al. 2023; Zhang et al. 2023). The gain in response rate from using a second incentive ranged from one percentage point (Messer & Dillman, 2011) to nine percentage points (Wagner et al., 2023) with an average of five percentage points.
Four studies reported 11 experimental comparisons using data from mail surveys (Moore & An, 2001; Messer & Dillman, 2011; Dykema et al. 2015; Dykema et al. 2021). The second incentive in mail surveys led to a lower response rate in two experiments (Dykema et al., 2015), but a higher response rate in the rest of comparisons that ranged from two percentage points (Dykema et al., 2015) to 34 percentage points (Dykema et al., 2021). On average, using a second incentive produced an increase of six percentage points in response rate to mail surveys.
In addition, eight studies reported 37 experimental conditions that varied the amount of the initial prepaid incentive and the amount of the second prepaid incentive (Moore & An, 2001; Teisl et al., 2006; Messer & Dillman, 2011; Dykema et al., 2015; Bucks et al., 2020; Dykema et al., 2021; Wagner et al., 2023; Zhang et al., 2023). The amount of second incentives didn’t seem to affect the resultant response rates to mail surveys when the initial incentive offered was $1. However, when the initial incentive was larger than $1, higher response rates were obtained when the second incentive was the same as or larger than the initial incentive. For instance, for mail surveys offering a $2 prepaid incentive at the first contact, the average response rate was 40% when the second incentive was less than $2, 48% with a $2 s incentive, and 55% when the second incentive was larger than $2. For web and mail mixed mode surveys, conditions offering a larger initial incentive ($5) led to higher response rates than conditions offering a $2 initial incentive. However, when the initial incentive was $5, offering a larger second incentive did not prove to be advantageous.
Four studies examined the impact of offering a second incentive on sample representation (Bucks et al., 2020; Dykema et al., 2021; Wagner et al., 2023; Zhang et al., 2023). Two of them did not find any differences in sample composition by whether a second incentive was offered (Bucks et al., 2020; Zhang et al., 2023). Dykema and colleagues (2021) showed that the second incentive improved sample representativeness. Although Wagner and colleagues (2023) did not find an impact of second incentives on distributions of age, gender, race and ethnicity, and household size of screener respondents, they did show that second incentives significantly increased the proportion of Black respondents from eligible households. Furthermore, second incentives significantly increased the proportions of Black and Hispanic respondents and marginally increased the proportion of respondents with lower educational attainment among those who eventually agreed to participate in the main study.
Three studies examined the impact of second incentives on costs. Two studies showed that second incentives resulted in higher costs per interview (Dykema et al., 2015; Messer and Dillman, 2011). Zhang and colleagues (2023) also found higher costs per interview associated with the use of second incentives when First Class was used for the nonresponse follow-up mailing. But they found that second incentives led to slightly lower costs per interview when priority was used for the nonresponse follow-up mailings.
These studies suggest a few overall trends. First, the use of a second prepaid incentive is effective in increasing response rates. Second, the impact of the second incentive depends on the amount of the second incentive; the second incentive is more effective when its amount is the same as or higher than the initial incentive. Third, the impact of second incentives on sample representation is inconclusive. Fourthly, second incentives tend to lead to higher costs per interview. We are not aware of any empirical research evaluating the impact of second incentives on nonresponse bias.
Given the first two trends, we didn’t attempt to replicate studies cited above to test different amounts of second incentives (e.g., a $3 s incentive vs. no second incentive) while holding constant the amount of initial incentives (e.g., an initial incentive of $2). Instead, independent of the incentive format experimental assignment we randomly assigned half of respondents to receive an initial prepaid incentive of $5 and no second incentives (“$5/$0” condition) and another half to the second condition (“$2/$3”—a typical design using second incentives). In this condition, all people were offered an initial prepaid incentive of $2 but nonrespondents by the time second incentives were mailed out were sent a second prepaid incentive of $3. We designed this experiment to dive deeper into the mechanism of second incentives. If people were motivated by a larger amount of incentive, then we would expect a comparable or even a higher response rate in “$5/$0” condition when everyone was given a $5 up front than “$2/$3” condition. However, if the second incentive motivated nonrespondents because it was the second time they were offered an incentive, then we would expect a higher response rate in the “$2/$3” condition than the “$5/$0” condition.
We contributed to the literature by comparing the split “$2/$3” condition to the “$5/$0” condition on response rate, sample composition, nonresponse bias in selected survey variables, and cost per completed interview.
We used data from the last wave of the National Study of Social, Economic and Health Experiences (NSSEHE) for this paper (Yan and Cantor, 2025). The NSSEHE is a panel study tracking changes in opinions, lifestyle, and health of Americans and the questionnaire included questions about household purchases, beliefs in public issues, health behaviors, health status, and life experience. A sample of 8000 registered voters in two states in the United States were sent mailings inviting them to participate in four web surveys about three months apart from each other. They were provided with a prepaid cash incentive of $5 in the first mailing and were promised a $20 Amazon.com Gift Card upon completing the first web survey. They were also told that they would be asked to participate in three more web surveys, would be given a $10 Amazon.com Gift Card for completing each of the three web surveys, and an additional bonus of $25 for completing all four web surveys. A total of 1412 completed the first wave at a response rate of 18% (AAPOR RR 1).
The experiment was implemented during the fourth (and the last) wave of data collection. A total of 1327 registered voters who had completed the first wave of data collection were invited back to participate in the fourth wave of data collection regardless of whether they had completed the second or third wave. (Eighty-five Wave 1 completes were not invited for Wave 4 because they asked to be removed from the study). Wave 1 respondents were randomized into one of the four experimental conditions, in a 2 by 2 design. Respondents assigned to Group 1 (Amazon ($5/$0)) were offered one initial incentive of $5 in the form of an Amazon.com Gift Card in the email invitation and no second incentive. Respondents assigned to Group 2 (Cash ($5/$0)) received a $5 cash incentive enclosed in the letter invitation and no second incentive. Respondents assigned to Group 3 (Amazon ($2/$3)) received an initial Amazon.com Gift Card worth $2 in the email invitation and a second Amazon.com Gift Card worth $3 at the fifth mailing. Group 4 respondents (Cash ($2/$3)) were offered a cash incentive of $2 enclosed in the letter invitation and a second cash incentive of $3 at the fifth contact.
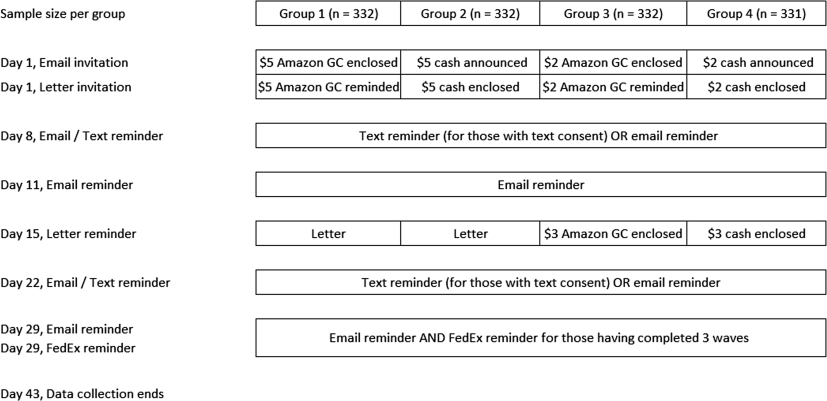
All respondents were sent a series of mailings, text messages, or email messages, as shown in Fig. 1. The first contact was an email invitation to the web survey. Those in Groups 1 and 3 (assigned to the electronic gift card conditions) received a Amazon.com Gift Card code in the email invitation (“As a token of appreciation of your continued effort, here is $5/$2 in the form of an Amazon.com Gift Card.”) Respondents in the cash conditions (Groups 2 and 4) were told in the email invitation that they would receive a cash incentive enclosed in a letter invitation mailed to them (“As a token of appreciation of your continued effort, we will enclose $5/$2 cash in the next mailing sent to your address.”).
The second contact was a letter invitation mailed out on Day 1. Those in Groups 2 and 4 (assigned to the cash incentive conditions) received a cash incentive enclosed in the mailing (“Recently we sent you an email inviting you to participate in the fourth survey of the National Study of Social, Economic and Health Experiences (NSSEHE). We have enclosed $5/$2 cash as a token of appreciation of your continued participation.”). Those in Groups 1 and 2 were reminded of the Amazon.com Gift Card code emailed to them (“Recently we sent you an email inviting you to participate in the fourth survey of the National Study of Social, Economic and Health Experiences (NSSEHE). The email invitation also included the code of a $5/$2 Amazon.com Gift Card as a token of appreciation of your continued participation.”).
The third contact was a reminder sent via text messaging for those who gave consent to be contacted by text or via email for those without consent. The text or email reminder was sent one week after the first two contacts. The fourth contact was an email reminder sent three days after the third contact to all who had not completed the web survey.
The fifth contact was a letter reminder mailed four days after the 4th contact. Those assigned to the “$2/$3” conditions were provided either an Amazon.com Gift Card code (Group 3; “We know your time is valuable and have enclosed a second token of appreciation in the form of a $3 Amazon.com Gift Card.”) or a cash incentive (Group 4; “We know your time is valuable and have enclosed a second token of appreciation in the form of $3 cash.”)
One week after the fifth contact, another reminder was sent via text messaging (for those consented to be contacted via text) or by email (for those without consent). One week later, an email reminder was sent to web survey nonrespondents as the 7th contact. A final reminder was sent via FedEx to those who have completed all three prior waves but have not completed the last survey yet.
Wave 4 data collection occurred between February 13, 2023 and March 27, 2023. In addition to the prepaid initial and second incentives, respondents were promised a $10 Amazon.com Gift Card upon completion of this last survey and an additional bonus incentive of $25 if they completed all four waves. At the end of the fourth web survey, one Amazon.com Gift Card code was displayed on screen that is worth either $35 (for those who completed all four waves) or $10 (for those who didn’t complete all four waves).
The experimental assignment was conducted before Wave 4 started, which ensured equivalent respondent experience with incentives across experimental groups. In other words, respondents in the four experimental groups had similar prior experience with cash and electronic gift card as incentives in the prior waves.
To answer research questions on response rate, we used AAPOR RR 1 formula to calculate response rate for each experimental condition. All Wave 1 respondents invited to Wave 4 were assumed to be eligible for Wave 4 and counted in the denominator. To formally test the main effect of the two experimental factors and the interaction effect between the two on response rate, we fit a logistic regression model predicting the likelihood to complete the Wave 4 web survey as a function of the two experimental factors.
To answer research questions on sample composition, we examined and compared distributions of several demographic characteristics suspected to be differentially susceptible to effects of the format of incentives including sex, age, race and ethnicity, education, and household income. We also examined respondents’ level of cooperation in terms of their participation in prior three waves of data collection.
To address research questions on nonresponse bias, we estimated nonresponse bias for answers to 24 survey items using Wave 1 data. The 24 survey items were selected because they were asked of everyone at Wave 1. Five of them are about purchasing of clothing in the last three months and four on ownership of different types of devices. They were asked in the earlier section of the questionnaire. Seven items are about whether respondents had experienced theft, two on break-ins, and six on attack. They were asked towards the later section of the questionnaire. The exact question wordings are displayed in Supplemental Materials. Answers to these twenty-four questions are related to respondents’ socio-economic status, especially age, education, and income. As a result, they are prone to potential nonresponse bias induced by the format of incentives and whether a second incentive was offered.
Under the deterministic survey response mechanism, nonresponse bias in the mean of a survey variable (b) is calculated as the difference between the mean of that survey variable estimated from those responding to Wave 4 () and the mean of that survey variable estimated from the full sample invited to take part in Wave 4 (), using the following formula (see Biemer & Lyberg, 2003):
We estimated nonresponse bias for 24 variables for each of the four experimental conditions, yielding a total of 96 nonresponse bias estimates. To formally test the impact of the two experimental factors on nonresponse bias estimates, we took the absolute value of each nonresponse bias estimate and conducted a two-way ANOVA on the 96 estimates with the absolute nonresponse bias as the outcome variable.
To answer research questions on cost, we calculated cost per completed survey. The cost only includes variable costs such as postages, cost of envelopes, printing and copying, and incentives. We did not include costs for programming and testing the web instrument and sample management.
All analyses were unweighted and conducted in R.
Table 1 displays (unweighted) response rates by experimental condition. Before the second incentive was provided at the 5th contact, respondents in Groups 1 and 2 received an unconditional incentive of $5 whereas those in Groups 3 and 4 received a prepaid incentive of $2. However, response rates for the $5 group were lower than those for the split incentive groups respectively, contradictory to the common belief that a higher prepaid incentive leads to a higher response rate. Conditions offering an Amazon.com Gift Card yielded lower response rates than conditions offering cash. Group 4 (Cash ($2/$3)) produced the highest response rate (60%) and Group 1 (Amazon ($5/$0)) the lowest response rate (48%). Significance tests found a marginal significant effect of the format of incentive but no significant effect of the initial incentive amount and no interaction effects.
Table 1 Web Completes and Response Rates (RR 1) by Experimental Conditions
5 vs. 0 USD | 2 vs. 3 USD | |||||||
Amazon (1) | Cash (2) | Amazon (3) | Cash (4) | |||||
Obs. | % | Obs. | % | Obs. | % | Obs. | % | |
Sample size | 332 | 100 | 332 | 100 | 332 | 100 | 331 | 100 |
End of data collection | 225 | 68 | 228 | 69 | 226 | 68 | 262 | 79 |
Before 2nd incentive | 160 | 48 | 181 | 54 | 167 | 50 | 200 | 60 |
Table 2 Logistic Regression Results
Coef. | Odds Ratio | Std.Err. | p-value | |
Before second incentive was offered | ||||
Intercept | 0.18 | 1.20 | 0.11 | 0.10 |
2 USD (vs. 5 USD) | 0.24 | 1.27 | 0.16 | 0.12 |
Gift Card (vs. Cash) | -0.25 | 0.78 | 0.16 | 0.10 |
Interaction | -0.16 | 0.85 | 0.22 | 0.48 |
End of data collection | ||||
Intercept | 0.79 | 2.19 | 0.12 | <0.001 |
2 USD (vs. 5 USD) | 0.59 | 1.80 | 0.18 | 0.001 |
Gift Card (vs. Cash) | -0.04 | 0.96 | 0.17 | 0.80 |
Interaction | -0.56 | 0.57 | 0.25 | 0.02 |
By the end of the Wave 4 data collection, the pattern of response rates across conditions remained the same. Group 4 (Cash ($2/$3)) still produced the highest response rate (79%) and Group 1 (Amazon ($5/$0)) the lowest response rate (68%). Group 2 (Cash ($5/$0)) and Group 3 (Amazon ($2/$3)) led to comparable response rates that fell in between. We fit a logistic regression model to formally test the impact of providing a second incentive and providing Amazon.com Gift Card on the likelihood of completing the web survey at the end of Wave 4 data collection. The results are shown in the bottom part of Table 2. Offering a combination of an initial and a second incentive significantly increased the likelihood of respondents completing the web survey than offering just one initial incentive. The format of incentive did not significantly affect respondents’ decision to complete the survey. However, there was a significant interaction between the two experimental factors. In particular, the advantage of offering a combination of an initial and a second incentive is observed only when a cash incentive was offered but not when an Amazon.com Gift Card was used.
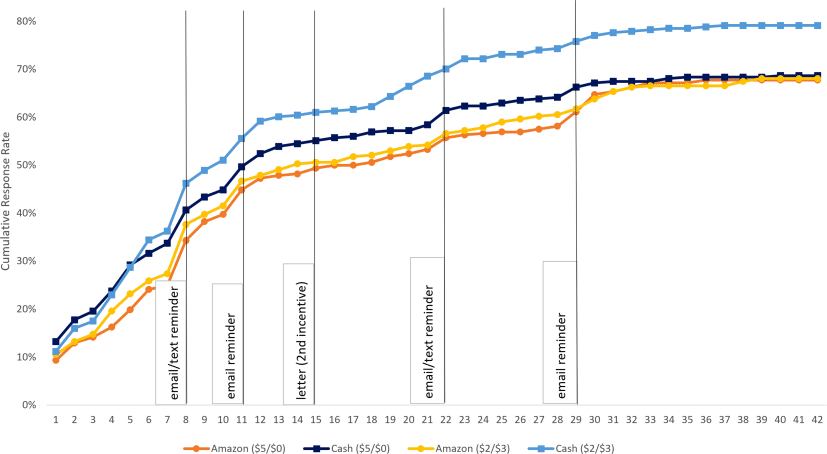
Fig. 2 displays the cumulative response rate throughout the data collection period for each experimental group (A table showing cumulative response rates before each contact is included in the Supplementary Materials). Overall, the two cash incentive conditions consistently had higher response rates than conditions receiving an Amazon.com Gift Card. Using both an initial and a second cash incentive (Group 4) induced a steeper jump in the cumulative response rate than Group 2 (which only received a $5 cash incentive at the initial contact) and Group 3 that offered an Amazon.com Gift Card as second incentives around day 19, which continued after the email/text reminder on Day 22. Offering a second incentive in the form of an Amazon.com Gift Card (Group 3) didn’t yield much advantage over Group 1, which received an Amazon.com Gift Card of $5. The two Amazon.com Gift Card conditions caught up with Group 2 (Cash ($5/$0)) after email reminders at the 7th contact.
Table 3 displays distributions of demographic characteristics of Wave 4 respondents by experimental group. The Chi-square test of independence didn’t find an association between the experimental groups and any of the demographic characteristic examined. In other words, the four groups share a similar distribution in terms of gender, age, race/ethnicity, education, and household income. Furthermore, the distribution of Wave 4 respondents completing all three prior waves of data collection did not differ by experimental group.
Table 3 Demographic Characteristics of Respondents by Experimental Group
Group 1 Amazon (%) | Group 2 Cash (%) | Group 3 Amazon (%) | Group 4 Cash (%) | Chi-squared test of independence | |
Gender | |||||
Male | 44 | 47 | 49 | 48 | χ2 (3) = 1.11, p = 0.78 |
Female | 56 | 53 | 51 | 52 | |
Age | |||||
18–49 | 36 | 35 | 38 | 45 | χ2 (3) = 6.67, p = 0.08 |
50+ | 64 | 65 | 62 | 55 | |
Race/ethnicity | |||||
Hispanic | 25 | 24 | 23 | 26 | χ2 (6) = 4.85, p = 0.56 |
Non-Hispanic White | 56 | 56 | 58 | 50 | |
Non-Hispanic Other | 18 | 20 | 19 | 24 | |
Education | |||||
Some college or less | 49 | 51 | 46 | 56 | χ2 (3) = 5.61, p = 0.13 |
College graduate | 51 | 49 | 54 | 44 | |
Income | |||||
Less than $75,000 | 44 | 47 | 47 | 50 | χ2 (3) = 1.29, p = 0.73 |
$75,000 or more | 56 | 53 | 53 | 50 | |
Completed all three prior interviews | |||||
Yes | 87 | 83 | 86 | 86 | χ2 (3) = 1.16, p = 0.76 |
No | 13 | 17 | 14 | 14 | |
Table 3 doesn’t show any evidence supporting our concern that the Amazon.com Gift Card would be more appealing to young respondents, respondents with high education, and respondents with a higher level of income. However, post-hoc pair-wise comparisons found that the difference in the share of respondents aged 18 to 49 between Group 4 and Group 2 (Cash ($5/$0)) is statistically significant (χ2 (1) = 4.61, p = 0.03) and so is the difference between Group 4 and Group 1 (Amazon ($5/$0), χ2 (1) = 4.13, p = 0.04). In addition, the difference between Group 4 and Group 3 (Amazon ($2/$3)) in the share of respondents with at least a college education is also statistically significant (χ2 (1) = 4.97, p = 0.03).
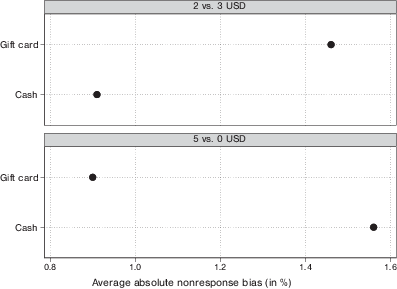
We estimated nonresponse bias in answers to 24 questions using Wave 1 data that is available for both respondents and nonrespondents to Wave 4 data collection. (The estimates are displayed in the Supplemental Materials). Overall, nonresponse bias is rather small with average absolute nonresponse bias ranging from 0% to 5% across questions and incentive conditions. A two-way ANOVA test conducted on the estimated absolute nonresponse bias for each question and each experimental condition found that neither experimental factor had a significant impact on absolute nonresponse bias, but the interaction effect was statistically significant (F(1,92) = 9.73, p = 0.002; ANOVA results were shown in Supplementary Materials). As shown in Fig. 3, offering a combination of an initial and a second incentive in the form of an Amazon.com Gift Card increased nonresponse bias but offering the same combination of incentives in the form of cash reduced nonresponse bias.
We calculated the cost of prepaid incentives, the cost of promised incentives (including $10 promised for completing Wave 4 for all as well as the bonus incentive of $25 for those who have completed all four waves), and mailing costs for each of the four experimental conditions. Presented in Table 4 are ratios of each condition’s costs in dollar amount over Group 2’s costs. A ratio of 1 means that the group’s costs are the same as those of Group 2. A ratio larger than 1 indicates that the group costed more than Group 2 whereas a ratio less than 1 suggests that the group costed less than Group 2.
Table 4 Ratio of Costs by Experimental Group
Group 1 Amazon ($5/$0) | Group 2 Cash ($5/$0) | Group 3 Amazon ($2/$3) | Group 4 Cash ($2/$3) | |
1 Costs included incentives promised for completing Wave 4 as well as bonus incentives promised for completing all four waves. | ||||
Ratio of cost of prepaid incentives (including both initial and second incentives) | 1.00 | 1.00 | 0.70 | 0.64 |
Ratio of cost of promised incentives1 | 1.01 | 1.00 | 1.01 | 1.17 |
Ratio of total cost of incentives1 | 1.01 | 1.00 | 0.95 | 1.07 |
Ratio of mailing costs (including postages, envelopes, printing, and copying) | 1.24 | 1.00 | 1.28 | 0.83 |
Ratio of total cost1 | 1.03 | 1.00 | 0.98 | 1.05 |
Ratio of cost per completed interview1 | 1.04 | 1.00 | 0.99 | 0.91 |
As shown in Table 4, the two groups offering both initial and second incentives (Groups 3 and 4) spent less on prepaid incentives than the two groups offering a larger initial incentive and no second incentive (Groups 1 and 2). However, the same two groups spent more on promised incentives because they yielded more completed interviews. The total costs for both prepaid and promised incentives (including incentives promised for Wave 4 and bonus incentives promised for completing all four waves) were the largest in Group 4, which produced the highest response rate and the largest number of completed interviews that received the promised incentives. However, the ratio for the total incentive costs for this group dropped from 1.17 (ratio of costs of promised incentives) to 1.07.
In terms of mailing costs, we added up the cost of postages, envelopes, and printing and copying for three postal mailings (letter invitations at the second contact, letter reminders at the fifth contact, and FedEx mailing at the last contact). The two cash conditions had lower mailing costs than the two Amazon.com Gift Card conditions partially due to differences in response rates before the second incentives were mailed out at the 5th contact.
The cost per completed interview is the lowest in Group 4 but the largest in Group 1. The cost per complete is very comparable for Groups 2 and 3. Table 4 suggests that, in terms of the cost per complete, splitting one initial incentive of $5 to an initial incentive of $2 and a second incentive of $3 is more cost effective because higher response rates reduced the number of mailings. In addition, the saving from the split incentive scheme is larger when offering cash incentives (0.91 for Group 4) than when offering an Amazon.com Gift Card (0.99 for Group 3).
This paper tested the impact of using a combination of an initial and a second incentive (vs. one large initial incentive) and the format of the prepaid incentive in a web survey of registered voters using a 2 by 2 factorial experimental design. Registered voters were randomly assigned to receive either one initial incentive or a combination of an initial and second incentives and to receive the prepaid incentive in the form of either cash or an Amazon.com Gift Card. We examined the impact of the two experimental factors on response rate, sample composition, nonresponse bias in selected survey variables, and cost per completed interview.
We found that, compared to offering one initial incentive, the combination of an initial and a second incentive led to higher response rates to our web survey. The gain in final response rate from using both an initial and a second incentive was about 10 percentage points when the incentive was in the form of cash despite the fact that Group 4 outperformed Group 2 by 5.9 percentage points before second incentives were sent. However, when incentives were in the form of an Amazon.com Gift Card, the final response rate did not differ by whether one incentive or two incentives (an initial and a second incentive) were offered. The findings suggested that respondents were more motivated by the second offer of cash incentives than by the total amount of cash incentives.
Our results suggest that cash is more highly valued than an Amazon.com Gift Card, even among our respondents who are relatively at ease with using the web and, presumably, digital transactions and who had been receiving promised incentives in the form of an Amazon.com Gift Card. Interestingly enough, we asked respondents at the end of the questionnaire their preference for the format of the incentive. Among the 934 respondents who provided an answer, only 7% of them preferred to receive a cash incentive mailed to them. Another 7% preferred a check to be mailed to them and 24% of them preferred a digital payment through Venmo (8%), Zelle (8%), Paypal (6%), Google Pay or Apple Pay (2%). Half of our respondents (50%) preferred the Amazon.com Gift Card, 3% other types of electronic gift cards, and 8% physical gift cards or debit cards to be mailed to them.
It is surprising that prepaid cash incentives maintained its edge in response rate over prepaid Amazon.com Gift Card in this experiment. We suspect that one possibility that Amazon.com Gift Card did not work as well as cash is that the Amazon offer was not noticed as readily by respondents as an offer of cash. We know that part of the allure of prepaid incentives is getting individuals to open and read their email. Cash may just be better at this than a gift card.
The two experimental factors did not have significant main effects nor interaction effects on sample composition except that the condition of using an initial and a second cash incentive resulted in more respondents aged 18 to 49 and more respondents with less education. It is reassuring evidence against survey researchers’ concern that electronic incentives may appeal more to younger respondents, respondents with a higher level of education, and respondents with a high level of income.
The two experimental factors did not have significant main effects on nonresponse bias in 24 survey estimates. But we found a significant interaction effects between the two. Specifically, offering both an initial and a second incentive in the form of an Amazon.com Gift Card increased nonresponse bias for the 24 selected items but offering an initial and a second incentive in cash reduced bias.
We found that the cost per completed interview is the smallest for the condition with the highest response rate (Group 4 offering both an initial and a second incentive in cash) and the largest for the condition offering only one incentive of $5 in the form of an Amaon.com Gift Card.
Our experiment is the first to experimentally assess and compare two different formats of prepaid incentives and the first one showing the promise of using a second incentive for web only surveys. Our results have two important practical implications for the survey field. First, despite the increasing number of transactions and subscriptions of Amazon.com and despite the fact that an Amazon.com Gift Card can be used immediately without leaving one’s home, offering Amazon.com Gift Card as a prepaid incentive did not encourage people to respond to the survey nor respond to the survey immediately. We encourage researchers to replicate our experiment and further research on the utility of alternative formats of incentives.
Second, our results suggest that the combination of an initial prepaid incentive of $2 cash and a second prepaid incentive of $3 cash led to the highest response rate, lower nonresponse bias in selected survey estimates, and the lowest cost per completed interview. It is more cost effective than offering a larger initial incentive and no second incentive. We encourage researchers to continue exploring the optimal combination of the initial and second incentives for web surveys and other types of surveys.
One additional point to the above results is the use of a pre-paid incentive, sent by mail, after the initial request is made by email (as in Group 4). It suggests that even when both an email and address are available, it is better to use both in the invitation and sending the pre-incentive in the mail. As shown above, this not only leads to higher response rates, but also is more cost effective.
There are a few limitations to our paper. First, the experiment was conducted on a sample of registered voters from two states. As a result, our results may not extend to surveys of other target populations. Second, the experiment was conducted on the 4th interview on respondents who had completed at least one interview with the same survey team. Our results may not extend to cross-sectional survey setting when initially contacting a sampled individual. Third, we did not design the study to fully cross the amount of the initial incentive, the amount of the second incentive, and the form of the incentives. It is possible that the advantages of splitting the $5 initial incentive into an initial incentive of $2 plus a second incentive of $3 do not apply to using, say, an initial incentive of $10. We encourage researchers to continue research on incentives for other types of surveys, for other target populations, and for different amount and format of incentives.
This work was supported by a grant awarded by the National Science Foundation (NSF-2050809) to Ting Yan (PI) and David Cantor (Co-PI).
AAPOR (2019). Report of the AAPOR task force on transitions from telephone surveys to self-administered and mixed-mode surveys. https://aapor.org/wp-content/uploads/2022/11/Report-of-the-Task-Force-on-Transitions-from-Telephone-Surveys-FULL-REPORT-FINAL.pdf. Accessed at 06/05/2026. →
Agarwal, A., Raad, D., Kairouz, V., Fudyma, J., Curtis, A. B., Schünemann, H. J., & Akl, E. A. (2016). The effect of a monetary incentive for administrative assistants on the survey response rate: a randomized controlled trial. BMC Medical Research Methodology, 16(1), 94. https://doi.org/10.1186/s12874-016-0201-8. →
Avery-Desmarais, S. L., McCurry, M. K., Sethares, K. A., Batchelder, A., & Stover, C. (2022). Internet recruitment of a diverse population of lesbian, gay, and bisexual nurses in a study of substance use and minority stress. Journal of Transcultural Nursing, 33(1), 118–125. https://doi.org/10.1177/10436596211042071. →
Becker, R., Möser, S., & Glauser, D. (2019). Cash vs. vouchers vs. gifts in web surveys of a mature panel study—Main effects in a long-term incentives experiment across three panel waves. Social Science Research, 81, 221–234. https://doi.org/10.1016/j.ssresearch.2019.02.008. →
Biemer, P. P., & Lyberg, L. E. (2003). Introduction to survey quality. Hoboken: John Wiley & Sons. →
Birnholtz, J. P., Horn, D. B., Finholt, T. A., & Bae, S. J. (2004). The effects of cash, electronic, and paper gift certificates as respondent incentives for a web-based survey of technologically sophisticated respondents. Social Science Computer Review, 22(3), 355–362. https://doi.org/10.1177/0894439304263147. a, b
Blohm, M., & Koch, A. (2021). Monetary incentives in large-scale face-to-face surveys: evidence from a series of experiments. International Journal of Public Opinion Research, 33(3), 690–702. https://doi.org/10.1093/ijpor/edab007. →
Bosnjak, M., & Tuten, T. L. (2003). Prepaid and promised incentives in web surveys: an experiment. Social Science Computer Review, 21(2), 208–217. https://doi.org/10.1177/0894439303021002006. →
Brick, J. M., Montaquila, J., Hagedorn, M. C., Roth, S. B., & Chapman, C. (2005). Implications for RDD design from an incentive experiment. Journal Of Official Statistics, 21, 571–589. a, b
Brown, J. A., Serrato, C. A., Hugh, M., Kanter, M. H., Spritzer, K. L., & Hays, R. D. (2016). Effect of a post-paid incentive on response rates to a web-based survey. Survey Practice. https://doi.org/10.29115/SP-2016-0001. a, b
Bucks, B., Couper, M. P., & Fulford, S. L. (2020). A mixed-mode and incentive experiment using administrative data. Journal of Survey Statistics and Methodology, 8(2), 352–369. https://doi.org/10.1093/jssam/smz005. a, b, c
Chen, J. S., Sprague, B. L., Klabunde, C. N., Tosteson, A. N. A., Bitton, A., Onega, T., MacLean, C. D., Harris, K., Schapira, M. M., & Haas, J. S. (2016). Take the money and run? Redemption of a gift card incentive in a clinician survey. BMC Medical Research Methodology, 16(1), 25–25. https://doi.org/10.1186/s12874-016-0126-2. →
Church, A. H. (1993). Estimating the effect of incentives on mail survey response rates: a meta-analysis. Public Opinion Quarterly, 57(1), 62–79. https://doi.org/10.1086/269355. a, b
Coopersmith, J., Vogel, L. K., Bruursema, T., & Feeney, K. (2016). Effects of incentive amount and type of web survey response rates. Survey Practice. https://doi.org/10.29115/SP-2016-0002. →
Dillman, D. A., Smyth, J. D., & Christian, L. M. (2014). Internet, phone, mail, and mixed mode surveys: the tailored design method (4th edn.). Wiley. a, b
Dykema, J., Jaques, K., Cyffka, K., Assad, N., Hammers, R. G., Elver, K., Malecki, K. C., & Stevenson, J. (2015). Effects of sequential prepaid incentives and envelope messaging in mail surveys. Public Opinion Quarterly, 79(4), 906–931. https://doi.org/10.1093/poq/nfv041. a, b, c, d, e
Dykema, J., Stevenson, J., Assad, N., Kniss, C., & Taylor, C. A. (2021). Effects of sequential prepaid incentives on response rates, data quality, sample representativeness, and costs in a mail survey of physicians. Evaluation & the Health Professions, 44(3), 235–244. https://doi.org/10.1177/0163278720958186. a, b, c, d, e
Gatney, H. H., Couper, M. P., Axinn, W. G., & Barber, J. S. (2009). Using debit cards for incentive payments: Experiences of a weekly survey study. Survey Practice. https://doi.org/10.29115/SP-2009-0034. →
Ichimiya, M., Muller-Tabanera, H., Cantrell, J., et al. (2023). Evaluation of response to incentive recruitment strategies in a social media-based survey. Digital Health. https://doi.org/10.1177/20552076231178430. →
Lederer, A. M. (2020). What do they want? Web-based survey incentive preferences among college students. American Journal of Health Studies. https://doi.org/10.47779/ajhs.2019.42. a, b
McGrath, D. E. (2006). An incentive experiment in the US consumer expenditure quarterly survey. In JSM proceedings (pp. 3411–3418). →
McKinsey (2022). Consumer trends in digital payments. https://www.mckinsey.com/industries/financial-services/our-insights/banking-matters/consumer-trends-in-digital-payments. Accessed at 6/05/2026. →
Mercer, A., Caporaso, A., Cantor, D., & Townsend, R. (2015). How much gets you how much? Monetary incentives and response rates in household surveys. Public Opinion Quarterly, 79(1), 105–129. https://doi.org/10.1093/poq/nfu059. a, b
Messer, B. L., & Dillman, D. A. (2011). Surveying the general public over the internet using address-based sampling and mail contact procedures. Public Opinion Quarterly, 75(3), 429–457. https://doi.org/10.1093/poq/nfr021. a, b, c, d, e
Moore, D. L., & An, L. (2001). The effect of repetitive token incentives and priority mail on response to physician surveys. In Proceedings of the American Statistical Association. Atlanta: Government Section on Survey Methods. a, b
Neal, Z., Neal, J. W., & Piteo, A. (2020). Call me maybe: Using incentives and follow-ups to increase principals’ survey response rates. Journal of Research on Educational Effectiveness, 13(4), 784–793. https://doi.org/10.1080/19345747.2020.1772423. →
Neman, T. S., Dykema, J., Garbarski, D., Jones, C., Schaeffer, N. C., & Farrar-Edwards, D. (2022). Survey monetary incentives: digital payments as an alternative to direct mail. Survey Practice. https://doi.org/10.29115/SP-2021-0012. a, b, c
Pew Research Center. (2022). Payment apps like Venmo and Cash App bring convenience—and security concerns—to some users. https://www.pewresearch.org/short-reads/2022/09/08/payment-apps-like-venmo-and-cash-app-bring-convenience-and-security-concerns-to-some-users/. Accessed at. →
Robbins, M., & Hawes-Dawson, J. (2020). The effect of incentives and mode of contact on the recruitment of teachers into survey panels. Survey Practice. https://doi.org/10.29115/SP-2020-0013. a, b, c
Singer, E., & Ye, C. (2013). The use and effects of incentives in surveys. The Annals of the American Academy of Political and Social Science, 645(1), 112–141. https://doi.org/10.1177/0002716212458082. a, b, c
Smith, M. G., Witte, M., Rocha, S., & Basner, M. (2019). Effectiveness of incentives and follow-up on increasing survey response rates and participation in field studies. BMC Medical Research Methodology, 19(1), 230–230. https://doi.org/10.1186/s12874-019-0868-8. →
Teisl, M. F., Roe, B., & Vayda, M. E. (2006). Incentive effects on response rates, data quality, and survey administration costs. International Journal of Public Opinion Research, 18(3), 364–373. https://doi.org/10.1093/ijpor/edh106. →
Wagner, J., West, B. T., Couper, M. P., Zhang, S., Gatward, R., Nishimura, R., & Saw, H.-W. (2023). An experimental evaluation of two approaches for improving response to household screening efforts in national mail/web surveys. Journal of Survey Statistics and Methodology, 11(1), 124–140. https://doi.org/10.1093/jssam/smac024. a, b, c, d, e
Yan, T., & Cantor, D. (2025). National study of social, economic and health experiences. 2025-10-31. Inter-university Consortium for Political and Social Research [distributor]. https://doi.org/10.3886/ICPSR-239497.v1. →
Zhang, S., West, B. T., Wagner, J., Couper, M. P., Gatward, R., & Axinn, W. G. (2023). Visible cash, a second incentive, and priority mail? An experimental evaluation of mailing strategies for a screening questionnaire in a national push-to-web/mail survey. Journal of Survey Statistics and Methodology, 11(5), 1011–1031. https://doi.org/10.1093/jssam/smac041. a, b, c, d, e