Pre-trained Nonresponse Prediction in Panel Surveys with Machine Learning
847310.18148/srm/2025.v19i2.8473Pre-trained Nonresponse Prediction in Panel Surveys with Machine Learning
John
Collins john.collins@mzes.uni-mannheim.de University of MannheimMannheimer Zentrum für Europäische Sozialforschung Mannheim Germany
https://orcid.org/0000-0001-7363-4299Christoph
KernLudwig Maximilian University of MunichMunich Center for Machine Learning (MCML) Munich Germany
123152025European Survey Research Association
Abstract
While predictive modeling for unit nonresponse in panel surveys has been explored in various contexts, it is still under-researched how practitioners can best adopt these techniques. Currently, practitioners need to wait until they accumulate enough data in their panel to train and evaluate their own modeling options. This paper presents a novel “cross-training” technique in which we show that the indicators of nonresponse are so ubiquitous across studies that it is viable to train a model on one panel study and apply it to a different one. The practical benefit of this approach is that newly commencing panels can potentially make better nonresponse predictions in the early waves because these pre-trained models make use of more data. We demonstrate this technique with five panel surveys which encompass a variety of survey designs: the Socio-Economic Panel (SOEP), the German Internet Panel (GIP), the GESIS Panel, the Mannheim Corona Study (MCS), and the Family Demographic Panel (FREDA). We demonstrate that nonresponse history and demographics, paired with tree-based modeling methods, make highly accurate and generalizable predictions across studies, despite differences in panel design. We show how cross-training can effectively predict nonresponse in early panel waves where attrition is typically highest.
1 Introduction
Panel surveys are an irreplaceable source of data for social scientists. These surveys require more skilled management and resources than one-time surveys, so sources of error must be controlled as much as possible (Pforr and Schröder 2016). Nonresponse is one of the more severe sources of survey error, and panel survey managers are increasingly under pressure to ameliorate nonresponse rates (Fuchs et al. 2013; Luiten et al. 2020). This paper is exclusively concerned with ”unit nonresponse“, that is, when a participant is invited to a panel wave and, for any reason, does not submit any usable data. This variety of nonresponse is distinct from permanent dropout from a panel or item nonresponse.
A promising approach to reducing nonresponse bias is the application of predictive modeling to forecast nonresponse in panel surveys. In this approach, practitioners build models that output each participant’s estimated nonresponse propensity. These estimates could then help to target the most at-risk participants with interventions aimed at mitigating their risk of nonresponse (Jacobsen et al. 2021; Jankowsky et al. 2022; Kern et al. 2021; Kocar and Biddle 2022; Mulder and Kieruj 2018). Machine Learning (ML) is an approach to predictive modeling. In this application, data collected about participants in a panel and their nonresponse history is used to train (i.e., ‘fit’) an ML model to predict future nonresponse behavior based on historic patterns (Hastie et al. 2009; James et al. 2013).
Many research papers have explored this approach to predicting participant nonresponse (Bach et al. 2020; Cheng et al. 2016; n. D.; Kern et al. 2019; Kocar and Biddle 2022; Mulder and Kieruj 2018; Olson 2013; Zinn and Gnambs 2022). However, most of these papers typically focus on one specific panel study, train a range of prediction models, and compare the results obtained for that panel. What is absent in this literature is an understanding of how well the findings about one panel study transfer to another panel. No two longitudinal studies are alike; they differ widely in their ‘survey design’, including characteristics such as the target population, the unit of study (i.e., individuals or household respondents), the mode, topics, and wave frequency. When a particular prediction approach is highly effective in one survey context, it is still an open question whether that technique will also be effective in another context.
Practitioners developing a new panel survey and interested in using predictive modeling are left uncertain as to which modeling approach from the literature to adopt. Practitioners could wait until they accumulate enough survey waves to train various models on their panel and select the best performer for future use. However, this requires the panel to accumulate many panel waves and potentially lose panelists during that time. In this paper, we present the possibility of “cross-training,” that is, using data from pre-existing panels to train a nonresponse prediction model and apply it to a new panel. Our underlying assumption is that ML models fitted on nonresponse history and demographic data are consistently effective so that these models can be transported across different contexts. Therefore, our first guiding research question is as follows.
1.1 What is the Predictive Performance of a Model Trained on One Panel but Applied to Another Study?
Assuming that transporting models is viable, we want to understand when and why these models can (or cannot) be interchanged between panels. For example, suppose nonresponse history and demographics like age and income are the key indicators of nonresponse across many different panels. In that case, it explains how cross-training would be effective because this predictive process is ubiquitous across contexts. Alternatively, cross-training between panels would likely fail if, for example, nonresponse history were more predictive in panels with monthly versus annual waves. To understand when cross-training may or may not be successful, we aim to analyze the consistency of the efficacy of the algorithms and predictors across different panel contexts. Therefore, our second research question is as follows.
1.2 Across Different Survey Contexts, is There a Difference in What Predictors and Algorithms are Effective in Predicting Nonresponse?
We test these questions by gathering data from five different panel surveys in Germany, each with a different survey design: the Socio-Economic Panel (SOEP), the German Internet Panel (GIP), the GESIS Panel, the Mannheim Corona Study (MCS), and the Family Demographic Panel (FREDA). These panels were selected to compare common differences between panel surveys. These studies encompass various sampling methods, recruitment methods, data collection modes, units of study, and wave frequencies. We derive equivalent features (i.e., predictors) across all datasets in each survey. For each dataset, we train a set of models and compare the predictive performance of each model for predicting nonresponse in each panel. Our study is the first to systematically (cross-)train and evaluate machine learning models for nonresponse prediction across multiple panels at scale.
Our study design allows us to identify which differences in survey characteristics cause certain algorithms to be specifically effective or reduce performance. We also compare the ‘permutation feature importance’ (PFI – Altmann et al. (2010)), which measures how much each feature contributes to predictive performance. We then evaluate whether specific features are always helpful for prediction-making in any context or whether certain features are more or less powerful under certain contexts.
We propose a process for exploring how ML models can be trained on one panel and applied to another. However, which algorithms and predictors should we explore? Furthermore, how would we evaluate them? In the Background Sect. 2, we establish that previous research has most often considered logistic regression or tree-based models trained on demographic and past-nonresponse behavior data. In the Methods Sect. 3, we introduce how we implement those modeling approaches using data from the five panel surveys. We also compare and contrast the design characteristics of each of these five panels. To answer research question one, we introduce a framework for ‘cross-training’ models, that is, training models on one panel’s data and then making nonresponse predictions in a another panel.
To answer research question two, we examine whether certain predictors are more or less important in different panels. In the Results Sect. 4, we show that cross-training can accurately predict nonresponse in the second wave of a given panel. The ubiquity of nonresponse history and demographics as effective predictors explains this outcome. In the Discussion Sect. 5, we consider what these findings should mean for survey practitioners and the limitations of this research.
2 Background
Many studies explore forecasting nonresponse in panel surveys (Bach et al. 2020; Hill et al. 2020; Jacobsen et al. 2021; Jankowsky et al. 2022; Kern et al. 2021; Kocar and Biddle 2022; Kreuter and Jäckle 2008; Lipps 2007; Lugtig 2014; McLauchlan and Schonlau 2016; Minderop and Weiß 2023; Mulder and Kieruj 2018; Plewis and Shlomo 2017; Roßmann and Gummer 2016; Siegers et al. 2021; Uhrig 2008; Voorpostel and Lipps 2011). In this section, we identify that nonresponse history and demographics are often the most powerful predictors of future nonresponse and that logistic regression and tree-based models are highly successful in many studies. This paper will take the extra step of demonstrating that these features and techniques are consistently effective across contexts and that this is why our proposed cross-training approach is viable.
For this study, we are only interested in discussing research that aims to predict future nonresponse instead of explaining it. Also, we are interested in predicting nonresponse propensity in the next wave, as opposed to other possible prediction units like survival time (Lemay 2009). This decision is because those units require more waves to assess the outcome, and we are interested in models that can be fitted as early as possible to reflect the survey practitioner’s need for timely forecasts.
Of the previous studies that aimed to predict future unit nonresponse, only one paper evaluated several surveys (although only one was a panel study) and systematically compared the results: Bach et al. (2020). In this paper, the authors applied a common set of algorithms across three surveys: the Longitudinal Internet Studies for the Social Sciences (LISS), the Survey on Free Time (SOFT), and the Employment and Purchase Behavior in Germany (EPBG). LISS is a household panel survey with around 5000 households sampled by geographic clustering across the Netherlands. LISS recruited households by mail, telephone, or face-to-face interviews. Regular surveys about topics concerning internet usage have been conducted online and monthly since 2007. SOFT and EPBG are cross-section surveys. SOFT was a 2013, US-based telephone survey with around 300 household respondents sampled by random selection of ZIP codes from the postal service registry. EPBG was a 2011 telephone survey of 12,400 Germans sampled from the federal administrative labor force records. Each survey collected different data, and the researchers used different covariates across the same set of models. Demographic data was available across all three surveys. The models for LISS used information about previous nonresponse history, while SOFT and EPBG used information from the recruitment process, such as the number of missed invitation calls. The two implemented prediction methods were logistic regression and gradient boosting (tree-based). The gradient-boosted models performed best, with very high Area Under Receiver Operator Curve (AUROC1) scores of 0.84 for EPBG, 0.88 for LISS, and 0.94 for SOFT. This study demonstrates the efficacy of tree-based models with demographics and nonresponse history, yielding 0.88 AUROC when forecasting nonresponse in the LISS panel.
Zinn and Gnambs (2022) trained models to predict next-wave nonresponse in the National Educational Panel Study (NEPS). NEPS is a panel survey, with waves running every six to twelve months, starting in 2009. The sample of over 40,000 German residents was drawn through cooperation with educational institutions. In each of the six cohorts recruited since 2009, there is a mixture of newborns, kindergarteners, primary schoolers, high schoolers, post-high schoolers, and post-tertiary adults. Zinn and Gnambs (2022) experimented with two models: Bayesian Additive Regression Trees (BART) and logistic regression. Because NEPS is focused on education-related topics, many of the model’s features were substantive information like the number of books a child has at home, the number of sick days taken, and demographics like migration background and federal state. Zinn and Gnambs report their results in terms of accuracy (the portion of correct predictions) as 89-99% for the first five waves of NEPS with both models. This study is an example of another successful implementation of tree-based and logistic regression models.
Kocar and Biddle (2022) predicted next-wave nonresponse in the Life in Australia (LIA) panel survey. LIA has run roughly monthly waves since May 2018. The sample was recruited by random digit dialing of registered numbers amongst the general Australian population. Interviews were conducted online. Kocar and Biddle used demographics, past nonresponse behavior, and online paradata such as browser type and page-click behavior. Kocar and Biddle fitted these features with a logistic regression model and achieved a recall score of over 0.9 and a (considerably lower) precision of 0.2. This study also shows the viability of logistic regression with demographic and past-nonresponse predictors.
Mulder and Kieruj (2018) predicted next-wave nonresponse in the LISS panel. They used features such as demographics, past nonresponse, physical/mental health, personality measures, and incentive sizes. Mulder and Kieruj used these features to build various prediction models: logistic regression, support vector machines, random forest, gradient boosted, and neural networks. The resultant Area Under Receiver Operator Curve (AUROC) scores ranged from 0.65 for the neural network to 0.79 for the random forest.
Kern et al. (2021) predicted next-wave nonresponse with the GESIS Panel. The GESIS Panel is a general German population panel with online/postal options, and the wave frequency is between two and three months. The authors used demographics, past nonresponse behavior, and rolling-average nonresponse rates with varying window sizes (i.e., average nonresponse over the past two waves, three waves, etc.). These researchers applied these predictors to various models, including logistic regression, random forest, and extra tree classifiers. Over the GESIS Panel waves from late 2013 to mid-2017, these models achieved average AUROC scores ranging from 0.86 with penalized logistic regression to 0.89 with random forest.
These studies show that panel study practitioners are interested in predictive modeling to intervene with at-risk participants preemptively. However, panel studies have different techniques for alleviating nonresponse bias. Numerous studies analyze the characteristics of responders and nonresponders to evaluate the risk of nonresponse bias and the effectiveness of nonresponse weights to mitigate such bias. Some examples of this analysis were carried out under the University of Michigan’s Panel Study of Income Dynamics (PSID) (Fitzgerald et al. 1998) and the United Kingdom’s Understanding Society panel (Lynn et al. 2023). Such explanatory (rather than predictive) modeling similarly indicates that a core set of individual characteristics can consistently differentiate between responders and nonresponders: Durrant and Steele (2008) analyze nonresponse in six United Kingdom Government surveys and report that only selected predictor variables (such as self-employment, household type, region) exhibit survey-specific effects while many demographic characteristics are important predictors of nonresponse for all six surveys.
This literature review shows that nonresponse history and demographics used in a logistic regression or tree-based model have often been effective in predicting nonresponse. Across these studies, AUROC values in the 0.8–0.9 range have been achievable with these techniques. However, not all implementations were equivalent in that model parameters varied, and the exact method for deriving each variable differed across studies. This paper aims to apply the same technique to various panels to understand which approaches are ubiquitously effective.
3 Methods
3.1 Data
We selected five panel surveys which cover a range of common panel survey designs. These panels target the general German population but vary widely in other respects. We have a wide range of maturities, with SOEP being a “traditional” and widely used panel study commenced in 1984, whereas FREDA is extremely recent, starting in 2021. The purpose of the surveys varies from FREDA, which is focused on family affairs, to the GESIS Panel, which is an omnibus survey. MCS is focused on the COVID-19 pandemic. Survey modes have been evolving over the past several decades, with face-to-face, phone, mail, and online modes all varying in prominence over time. Throughout its lifetime, SOEP has employed many different survey modes, including face-to-face and mail, compared to the GESIS Panel and FREDA, which focus on mail and online data collection. GIP and MCS are entirely online panels. By comparing these surveys, we evaluate how prediction techniques in one era and with one given study objective can generalize to another context. In the following sections, we describe each panel in detail before summarising their similarities and differences in Table 1.
Table 1 Comparison of survey designs. F2F: Face-to-Face, HH: Households, I: Individuals
Characteristic | SOEP | GIP | GESIS Panel | MCS | FREDA |
Started | 1984 | 2012 | 2013 | 2020 | 2021 |
Modes | F2F, Phone, Post, Online | Online | Online/Post | Online | Online/Post |
Wave Frequency | Annual | Two months | Two-three months | Weekly | Three months |
Unit of study | HH/I | HH/I | I | I | Family/singles |
Sampling Method | Regionally clustered, multi-stage random samples | Regionally clustered, multi-stage random samples | Probabilistic sample of the German-speaking population | Regionally clustered, multi-stage random samples | Probabilistic sample of the German-resident population |
Recruitment age | 16+ | 16-75 | 18-70 | 16-75 | 18-49 |
Recruitment method | F2F/Phone | F2F | F2F | F2F | Phone/Post |
Main Topics | Economics, politics, psychology | Attitudes, politics, economics | Omnibus | COVID-19 | Family and relationships |
3.1.1 The Socio-Economic Panel (SOEP)
The Socio-Economic Panel (SOEP) is a German general-population household survey (Liebig et al. 2022). SOEP collects data about economic matters, political attitudes, and psychological factors, among other topics. It has been running annually since 1984. In this paper, we follow the initial recruitment intake of 15,000 participants, which has steadily declined to around 2500 as of 2020 (see Fig. (Appendix) 1). Over the years, survey modes have included face-to-face, phone, mail, and online. (DIW Berlin 2023; Goebel et al. 2019; Siegers et al. 2021). The initial sampling method selected households by random walks across geographic regions to provide a representative sample of Germany at the time (i.e., pre-reunification). For each household, every resident over the age of 16 was invited to provide an individual response. Also, a ‘head of household’ provides information about the whole household. SOEP panelists can exit the survey by explicit request, death, or moving abroad.
3.1.2 German Internet Panel (GIP)
The German Internet Panel (GIP) is a general German population survey concerning politics and economics, among other topics (Blom et al. 2015, 2022). The panel commenced in 2012 and runs waves every two months. We follow the initial recruitment intake of roughly 1500 participants (see Fig. (Appendix) 1). The survey mode is online only. Initial sampling was based on geographic stratified clustering, in which regions of roughly equal populations were selected to be representative of Germany’s distribution of federal states and urbanity. German residents aged 16 to 75 were eligible to participate. Participants were recruited by face-to-face interviews, and subsequent waves were conducted online. Households without sufficient internet or computer access were provided with devices and support.
One issue with GIP data is that the published dataset does not include whether participants have asked to exit the panel. As a result, we cannot distinguish between temporary nonresponders and permanent dropouts. In other panels, we can exclude exited participants and analyze only temporary unit nonresponse. This matter has the effect of making the apparent GIP active panel size (the number of participants invited to each wave) stay at roughly 1500 over time, whereas other panels attrite invitees (see Fig. (Appendix) 1).
3.1.3 GESIS Panel
The GESIS Panel is an omnibus survey of the general German population, covering topics such as politics, time use, and well-being (GESIS 2023). It commenced in October 2013 and ran in two-monthly waves until February 2021, when the wave frequency became three-monthly.
We follow the initial recruitment intake, which commenced with roughly 5000 participants and steadily declined to around 2500 by 2021 (see Fig. (Appendix) 1). The survey has two modes: Web (roughly 75%) and mail (Bosnjak et al. 2018; GESIS 2021, 2023). The GESIS Panel’s sampling method randomly selected invitees from the German population register. The recruitment criteria allowed German residents between the ages of 18-70 to participate. Recruitment interviews were conducted face-to-face. Panelists exit the study either by explicit request or by nonresponding to three consecutive waves.
There is a peculiarity regarding the GESIS Panel’s first two post-recruitment interview waves (waves 3 and 4). Recruitment took many months, but the Panel managers were concerned about losing participants if they were not contacted for a long time. Therefore, only the participants recruited by that time were invited in these early waves. The result is a substantially smaller sample in those early waves (Bosnjak et al. 2018).
3.1.4 Mannheim Corona Study (MCS)
The Mannheim Corona Study (MCS) was a survey of individuals concerning how COVID-19 affected the daily lives of the general German population. The panel ran weekly waves for 16 weeks from 20th March to 10th July 2020. All waves were administered online. The same team managed the Mannheim Corona Study as the GIP, and the participants were a randomly selected subset of GIP participants as of 2020, which was larger than its initial recruitment size of 1500 (because of additional intakes in 2014 and 2018). Therefore, unlike all other surveys in this study, MCS did not start with a typical recruitment survey because the participants had already been recruited (Blom et al. 2021). Because the survey only ran for 16 weeks, participants who committed to the study were invited every week. Cases of requests to exit were minimal, and no data is available on those requests. Therefore, the apparent sample size of eligible panelists for MSC, like GIP, stays constant at 4400 invitees (see Fig. (Appendix) 1).
3.1.5 The German Family Demography Panel Study (FREDA)
The German Family Demography Panel Study (FREDA) is a panel survey that aims to study family life and relationships (including singles) in Germany (Bujard et al. 2023). The waves are annual, consisting of three sub-waves three months apart each year. Starting in 2021, in each subwave, around 38,000 participants were invited to respond. The modes were online and mail. Initial sampling was random sampling from the population register. German residents between 18-45 years of age were eligible to participate. As of this paper, only the first three sub-waves of data have been published (Federal Institute for Population Research 2022). Therefore, we can evaluate how predictive techniques perform when applied to a freshly commenced panel survey. Currently, participants who completed the first wave are all invited to the second and third wave, so none have yet exited the panel.
3.2 Design Comparison
Table 1 summarizes the above panel design aspects. We can see that all panels target the German population. However, they differ in various aspects: One of the most substantial differences is the wave frequency, ranging from annual to weekly waves. We expect that the period between waves would impact the drivers of nonresponse because the frequency leads to very different commitments of time and discipline. Another important consideration when comparing panel surveys is the treatment of the recruitment interviews. Each panel, except for MCS, starts with a recruitment interview, and we can only access data about those participants who responded because those who did not participate did not agree to have their data shared. The result is that when predicting nonresponse in the first post-recruitment wave, the models trained on data from recruitment waves are missing nonresponse history, which we expect to be a very important predictor. This issue needs to be kept in mind when we review our results.
3.3 Modeling Setup
3.3.1 Outcome
The dependent variable that each model aims to predict is each participant’s nonresponse at the next wave in a given panel. We provide the American Association for Public Opinion Research (AAPOR) response codes we consider nonresponses in Table (Appendix) 3. Where possible, we aim to follow AAPOR’s definition of nonresponse ‘RR6’, which includes partial responses, failure to make contact, implicit and explicit refusal, and the participant’s incapacity or death. However, AAPOR response codes are only available for the GESIS Panel and FREDA. We attempted to derive similar response codes for the SOEP, which predates the AAPOR standard and adopted the system only in later waves. Furthermore, nonresponse in the GIP can only be inferred based on whether a given participant ID is not present in the wave. MCS records only a binary ‘participation’ variable, so we cannot infer the specific type of nonresponse. See Table (Appendix) 3 for the data used to derive nonresponse in each panel.
We filter data only to include members of each panel’s first recruitment intake to avoid any effect of sample refreshment. Finally, each survey wave is given an individual date to compare panels over time. We date each survey from the start of the data collection period as many of them do not publish a specific end date of data collection. Figure (Appendix) 2 shows the timeline of nonresponse rates at each wave for each panel we are analyzing. Nonresponse in GESIS starts high (20–25%) and falls gradually (10%) as low-propensity participants exit the panel, leaving only “reliable” participants. In GIP and MCS, participants are never removed from the panel for consecutive nonresponses, so the subsequent nonresponse rate climbs over time, from 20 to 40% and 18 to 24%, respectively. SOEP maintains a steady average nonresponse rate between 8‑12%, likely because the managers maintain a target response quota and have a year to meet it. Nonresponse rates were 41 and 45% across the second and third FREDA waves.
3.3.2 Predictors
To predict each participant’s propensity of nonresponse in the next wave, we input the data we have about each participant as of a given wave into an ML algorithm. We use ‘Temporal Cross-Validation’, meaning we iterate over waves in which we predict nonresponse using only data available up until that time (Bergmeir and Benítez 2012; Kern et al. 2021).
Table 2 details the variables we derived from each panel to make predictions. The predictor variables are selected to cover common types of predictors used in past research as long as those covariates can be derived from all five panels of our study. Following previous studies in the literature review, we focus on socio-demographic characteristics and nonresponse history. To account for the concept of survey fatigue (Lugtig 2014), we additionally include a variable for the number of waves each participant has been invited to thus far. These are variables that all of the panel surveys collect despite their different topics of focus. For each demographic variable, we also include a binary variable indicating missingness. Also, the different panels refresh demographic data at different intervals: GESIS, SOEP, and GIP periodically update demographic data, but FREDA and MCS have such short running times that these variables are, in practice, time-invariant in those cases.
Note that we scale (standardize) each continuous variable using only data available at the time of prediction. This way, our retrospective models are fitted the way they could have been at the time. Table (Appendix) 1 shows the descriptive statistics of the unscaled predictor variables across all panels.
Table 2 Predictors derived for each panel
Type | Variable | Value range | Description |
Socio-demographics | Is Married | 0, 1 | The respondent positively self-identifies as married. |
| Age | 0 – infinity | Derived by the survey date and year of birth. |
| Household Size | 0 – infinity | Count of people residing in the participant’s residence. |
| Household Income | 0 – infinity | Monthly combined income of the participant’s household in Euros. |
| Personal Income | 0 – infinity | Monthly personal income in Euros. |
| Is Female | 0, 1 | The participant indicated a ‘female’ sex. |
| Is Unemployed | 0, 1 | The participant self-identifies as unemployed. We treat part-time, full-time, and parental leave as employment. Unemployment includes studying, retraining, or being retired. |
Response history | Invited Waves | 1 – infinity | Count of the number of waves this respondent had ever been invited to. |
| Nonresponse This Wave | 0, 1 | Indicates if the participant did not respond in the current wave. |
| Historic Nonresponse Rate | 0 – 1 | The participant’s average nonresponse rate over all of their invited waves. |
3.3.3 Prediction algorithms
In this study, we test prominent models representing the main types of classification algorithms explored in past research.
Logistic regression. Regression models are often successful when classification can be made by additively summarising the effects of the covariates. We evaluate penalized and unpenalized logistic regressions (Le Cessie and Van Houwelingen 1992; Tibshirani 1996). Although logistic regression can be specified to account for feature interactions by deliberately building in interaction terms, we use this method with only main effects as we use other algorithms that can algorithmically account for interactions in this study.
Random forest. Tree-based models are often successful in cases where there are complex interactions between variables. A random forest is a set (‘ensemble’) of decision trees tuned to maximize the homogeneity of cases at the endpoint of each decision path. The final prediction is based on the portion of decision trees that ‘vote’ for each classification (Breiman 2001; James et al. 2013).
Gradient Boosted Classifier (GBC). This algorithm is similar to random forest, except that trees are built sequentially rather than independently. Compared to random forests, boosting may achieve better performance when predicting nonresponse but needs more careful model tuning because small changes in the ensemble setup can greatly impact the results (Friedman 2001; James et al. 2013).
For each algorithm, we repeat the training process with different parameter settings. This process is a common part of ML modeling, called ‘hyperparameter tuning’, and is intended to discover, by experimentation, which parameters (in this context called ‘hyperparameters’ 2) are the best algorithm settings (Feurer and Hutter 2019). We will trial parameters as described in Table (Appendix) 2. For completeness, we present the results of all hyperparameter settings.
3.3.4 Model Comparison
We limit the maximum number of preceding waves used in the training set to avoid long-fitting times and adverse impacts from using training data from too far in the past to be relevant. Therefore, the maximum number of training waves for all panels is up to the ten most recent waves for each test wave. For the GESIS Panel, SOEP, and GIP, we test our models on the second through to the 20th survey wave. This limitation is also to avoid long computation times and also we are concerned with nonresponse in the earliest stages of a panel. We test our models for MCS on the second through to the sixteenth wave, which is all available data. For FREDA, we test on the second wave, as only three waves are currently available. We predict nonresponse in each of the outlined waves and calculate the AUROC, recall, and precision scores. Recall is the proportion of positive cases that the model correctly identifies3. Precision is the proportion of predicted positive cases that are true positives4. AUROC is a value between 0 and 1, indicating the trade-offs between false positives and false negatives. An AUROC of 0.5 represents the worst possible binary classifier, and 1.0 is the best score.
Further, we compare models through Permutation Feature Importance (PFI)5. PFI measures how much a given predictor contributes to a model’s predictive performance (Altmann et al. 2010; Oh 2022; Saarela and Jauhiainen 2021). Feature importance is calculated by taking a trained model and then scrambling each predictor’s values by randomly shuffling values in that column for each predictor in the test data. That test data, with a single scrambled predictor, is inputted into the trained model, and the AUROC score of those predictions is calculated. We repeat this process ten times for each predictor with a different random shuffle. Each predictor’s PFI is the average loss in AUROC compared to the original performance in the test dataset. Because the shuffling neutralized the predictive power of the scrambled predictor, the loss in AUROC indicates how much predictive performance is contributed by that predictor. We calculate the PFI for each wave and report the average for each variable across each panel. However, this method is vulnerable to covariation. That means that when two predictors are correlated, withholding one predictor will not substantially reduce AUROC because the same information is still available to the model through the other covariate. This issue means that correlated predictor pairs will have their relative PFI understated. When we examine PFI, we must remember that selected pairs of variables may have their importances understated. Missing value flags, for instance, covary with nonresponse.
3.4 Cross-Training
In this paper, we train models on one panel and then use them to make nonresponse predictions in another panel. To make the most use of our data, we conduct cross-training, in which the training panel (i.e., the panel survey used for model training) both predates and post-dates the test panel. For example, we will show how SOEP data from 1985 can predict nonresponse in GIP in 2012 but also apply a model trained on GIP’s 2012 data to predict nonresponse in SOEP in 1985. We provide two different methods for deriving the training data, and evaluate both. These two methods are as follows. Fig. 1 provides an illustrated example of each method.

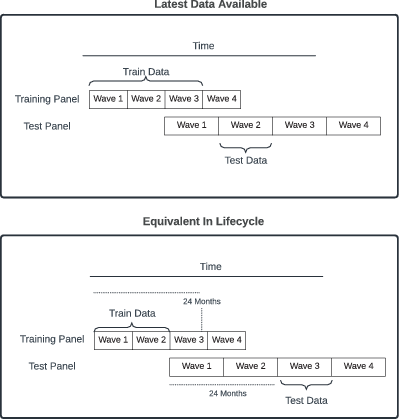
Fig. 1 Examples of the two methods for cross-training models. Here, we have a training and a test panel, each with different lengths of time between waves. In the ’latest data available’ approach, we can train a model using only data available by the start of the test wave. Because wave four of our training panel was still in its fieldwork period when the test wave started, we can only use data from up to wave three of the training panel. In the ‘equivalent in lifecycle’ approach, we calculate that our test wave commenced 24 months into the panel’s lifetime. Therefore, we train a model on any data that was available in the training panel within 24 months of its respective lifecycle. Because wave three of the training panel was still in fieldwork as of 24 months, we use up to wave two for the training data
3.4.1 Latest Data Available
In this method, for each wave in the test panel (i.e., the panel study used for model evaluation), we train a model on a fixed number of waves (in our case, five) from the training panel, which precede the start date of that target wave. For example, the first wave of the GESIS Panel was administered in 2013. We can train a model on five SOEP waves from 2007 to 2012 and then use that model to predict nonresponse in the first GESIS Panel wave in 2013. This method aims to train a model using waves that are close to the target wave in time because we expect the contexts to be most similar when they are close together in time.
Note that we can only report results with this method for cases where the training waves predate the target wave. Therefore, we cannot, for example, predict nonresponse in the starting waves of SOEP with GESIS Panel data. Instead, we predict later SOEP waves once data from other panels becomes available. Also, we do not cross-train between GIP and MCS because they are drawn from a common set of individuals.
3.4.2 Equivalent In Lifecycle
For each wave we predict nonresponse in the target panel, we train a model on all waves in the training panel available at the equivalent point in the survey’s lifetime. For example, the fourth GESIS Panel survey wave takes place 12 months after the first survey wave. We thus can train a model on SOEP data using waves that took place up to 12 months from the start of SOEP (which would be only the first SOEP wave because it is an annual survey). Conversely, the third SOEP survey wave takes place 24 months after the start of SOEP, and we can predict nonresponse in this wave using a model trained on the 12 GESIS Panel waves that took place within 24 months of the start of the GESIS Panel. This cross-training approach aims to compare equivalent periods in the survey’s lifetime by, for example, applying a model trained on the early period of one panel to the equivalent period of the other panel.
4 Results
4.1 Model Comparison
We commence our results analysis by establishing a baseline of prediction models’ performances. Fig. 2 shows the performance results from training each model type with data of the same panel study, using information available as of each given target wave starting from the second wave of each survey. In the early waves, AUROC is rather low (<0.8) across all panels except MCS, the second wave of the SOEP (in which there was substantial nonresponse, making it easy to anticipate correctly), and the random forest models in the GESIS Panel. This limited early performance may be because insufficient training data had accumulated at that point to build effective models.
In addition, the recruitment waves may be detrimental as training data. Each panel, except for MCS, starts with a recruitment interview, and the GESIS Panel commences with a two-stage recruitment (the same participants are interviewed across two recruitment waves). Predicting nonresponse following a recruitment interview is a fundamentally different process than predicting nonresponse from a regular panel wave, and models trained on the former might not reliably predict the latter. However, once the recruitment waves are over and more training data accumulates, we can see substantial improvement in AUROC across all panels.
Comparing performance across panels (Fig. 2), there is a trend that shows higher prediction performance for panel studies with more frequent panel waves. SOEP, an annual survey, has an average AUROC of just below 0.8, while GIP and the GESIS Panel, both two-monthly surveys in this period, are around 0.9 and 0.8, respectively. MCS, which features weekly surveys, exceeds 0.9. Predicting nonresponse in FREDA, which, as of writing, has only one recruitment wave and one regular wave for which we know the dependent variable values, performs poorly at a high score of 0.6.
Each type of model performs equally well. Aside from the results for MCS, however, tree-based models perform better than logistic regression in the earliest one or two waves of a panel study. This outcome indicates that flexible models have a slight advantage in early waves, but in later waves and established panels, main effects models may be sufficient to achieve good performance. Equivalent figures providing recall and precision scores are provided in Figures (Appendix) 3 and 4.

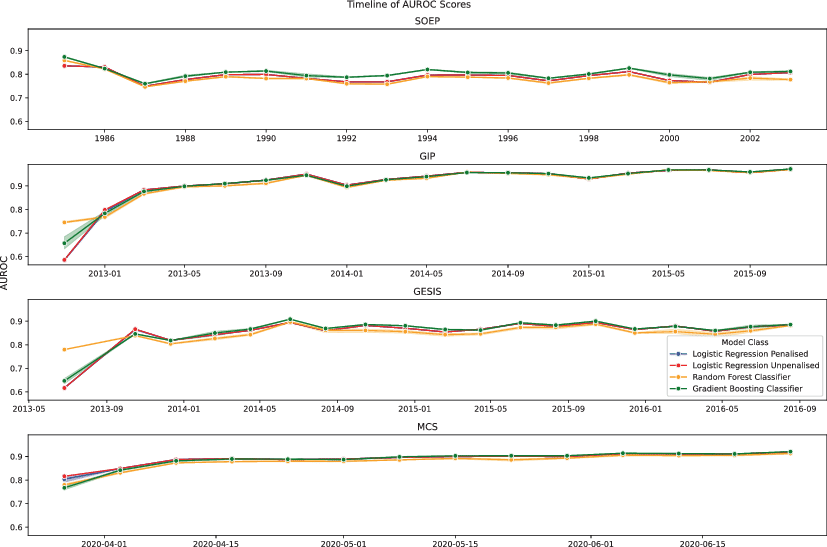
Fig. 2 Comparing model performance across panels where each model is trained using up to 10 preceding waves of the same panel. Auras around the lines are the range of scores across different hyperparameter values. However, models with different hyperparameter settings have such close values that these auras are hardly visible. In the FREDA survey, we can only predict nonresponse in wave three based on the data from wave two, with a model trained on wave one. In that wave, all models achieved roughly 0.6 AUROC
Fig. 3 shows which features were most predictive across different panels. As survey wave frequency increases (GIP, GESIS Panel, MCS), historic nonresponse becomes more important for all models. As survey waves become less frequent (SOEP, FREDA), demographic features become relatively more important. However, nonresponse history remains important across all models and panels, except for FREDA (because data on nonresponders in the first recruitment interview is omitted, meaning there is no nonresponse history to exploit in the first training wave).

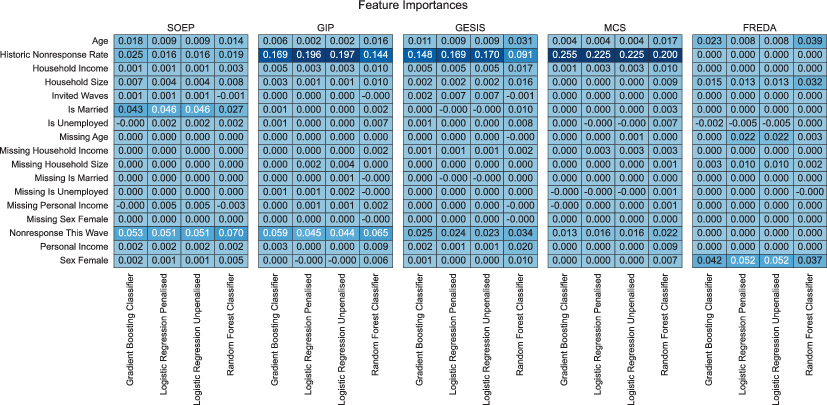
Fig. 3 Heatmap comparison of permutation feature importances across panels
Survey mode has little impact. GESIS Panel is a mixed mode panel study, while GIP and MCS are both online-only, yet they all have similar feature importance profiles. Age is a relevant predictor across all panels, although often more important to random forest models, indicating that age may have an interactive or non-linear effect. This outcome corresponds to other research, which shows that very young and very old participants are particularly at-risk groups for nonresponse (Lipps 2009).
From this analysis, we can address our second research question. Nonresponse history and demographics are ubiquitously effective across all of the panels analyzed in this paper. AUROC scores after the first few waves of data had accumulated converged across all panels at around 0.75–0.85. Tree-based models are usually better than logistic regression, but logistic regression is often almost as good and sometimes slightly better.
4.2 Model Cross-Training
Fig. 4 shows the result of training nonresponse prediction models on each of our five panel studies and applying them to the GESIS Panel. The results of all other cross-training exercises are detailed in the Appendix section 6.2. Except for MCS as the target panel, all cross-trained models start with low AUROC when applied to predict next-wave nonresponse in the respective first wave of a different panel, with a high of 0.65 when nonresponse in SOEP is predicted with a model trained on GESIS Panel data (Fig. (Appendix) 6. However, when predicting next-wave nonresponse based on data from the second wave, for all models except those trained on FREDA data, the performance of the cross-trained models is often the same or better than the baseline models’ performances (which use training data from the same panel). The results show that pre-trained models can achieve AUROC values over 0.75. This performance is seen when nonresponse in the GIP is predicted with models trained on SOEP or GESIS Panel data (Fig. (Appendix) 7); when models predict nonresponse in the GESIS Panel trained on SOEP, GIP or MCS (Fig. 4); when nonresponse in the MCS is predicted based on models trained on SOEP or GESIS Panel data (Fig. (Appendix) 8); or when nonresponse in FREDA is predicted by models trained on any other panel (Table (Appendix) 5 and 6).

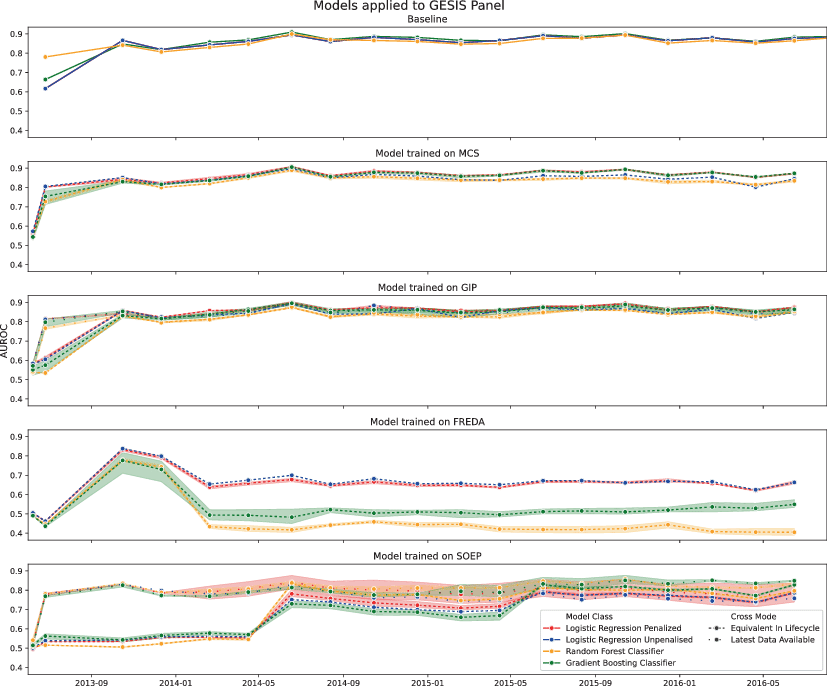
Fig. 4 Models trained on other surveys but applied to the GESIS Panel. The ‘Baseline’ subplot shows performance results when models are trained using training data of the same panel as the target wave. Auras around the lines indicate the range of performance values across different hyperparameter settings
Critically, when cross-trained models predict next-wave nonresponse based on the second wave of a target panel, using the ‘Latest Data Available’ approach, AUROC was always the same or higher than the baseline approach. Also, although the baseline approach could have been conducted in practice, it would have required training the model as soon as the data collection period ended for a given wave and applied immediately to the next wave, which is potentially a short time window. The pre-trained model could have been ready beforehand, and predictions about participants could have been made as their responses became available. Using a pre-trained model could be a valuable innovation for newly commencing panels. The strong performance of pre-trained models is likely because they benefit from more training data than the baseline approach.
However, not all cross-training applications are successful. Firstly, using training data that was available as close as possible to the date of the test wave (‘Latest Data Available’ method) was much more successful than using the ‘Equivalent in Lifecycle’ method. This result implies a temporal effect, such that training data is more effective when it is closer by date to the target wave, even when the training data is from a different panel. Models trained on FREDA data often performed poorly, likely because of limited training data. Pre-trained tree-based models outperformed logistic regression models on average across all panels, indicating that flexible models have advantages over main effect models in this context.
5 Discussion
This paper presents the first demonstration of ‘cross-training’ for nonresponse prediction in panel surveys. We show that predictors of nonresponse are so consistently effective across diverse contexts that it is possible to predict nonresponse effectively in the second wave of a panel study using models trained with data from a different panel. This finding is important because a pre-trained model would be available to make predictions sooner for waves one and two than a panel-specific model, which can only be developed once the required training data is available. This timeliness can be critical in the early waves of a panel study, where attrition is often highest.
However, not all applications of cross-training were successful, with some cases performing worse than baseline models and exhibiting low-performance scores. Predicting the very first wave with a pre-trained the model was generally unsuccessful. However, in the second wave, nonresponse can be predicted accurately, with AUROC scores of 0.75 to 0.85, and pre-training can outperform baseline models as they ‘borrow’ training data from multiple waves of another panel study.
The main limitation of this research is the number of panels we could compare. A considerable effort is required to process the raw survey data of multiple panels into a common set of features. Including more panel surveys would risk certain surveys not collecting all the same features. Another limitation of this study is that each panel we compare aims to study the general German population. This limitation means we could not compare the effect of different population frames.
The main contribution of this study has been to show that the processes driving panel nonresponse can be very similar between panels despite different survey designs. In our comparisons, only the frequency of survey waves stood out as a factor that influences nonresponse predictability, such that more frequent panels are more predictable. Overall, our findings imply that modeling techniques proven effective in one panel should interest managers of similar panels when deciding their modeling approach. Also, it is possible to pre-train models on one survey and apply them to another with high predictive accuracy. This novel technique could allow survey managers to target and intervene with low-propensity participants in the earliest, most critical waves of a panel study, thereby reducing attrition.
How should panel managers commencing a new panel make use of pre-trained nonresponse models? The suggested method, based on this paper’s results, is as follows. Firstly, the best type of panel to use as pre-training data is one that targets the same population of interest. It is also beneficial to use training data that was collected close in time to the target waves. In such cases, fit the model to predict next-wave nonresponse using up to five waves that commenced closest to the start date of the new panel. During the first field period of the new panel, the pre-trained model will not make accurate predictions about who will nonrespond in wave two, so attempting to do this is not recommended. Instead, during the second field period, as responses come in, the model can be used to estimate nonresponse propensity for each participant based on their behavior in the first and second waves.
1 Supplementary Information
Appendix References
Altmann, A., Toloşi, L., Sander, O., & Lengauer, T. (2010). Permutation importance: a corrected feature importance measure. Bioinformatics, 26(10), 1340–1347. https://doi.org/10.1093/bioinformatics/btq134. a, b
Bach, R. L., Eckman, S., & Daikeler, J. (2020). Misreporting among reluctant respondents. Journal of Survey Statistics and Methodology, 8(3), 566–588. https://doi.org/10.1093/jssam/smz013. Number: 3. a, b, c
Bergmeir, C., & Benítez, J. M. (2012). On the use of cross-validation for time series predictor evaluation. Information Sciences, 191, 192–213. https://doi.org/10.1016/j.ins.2011.12.028. Publisher: Elsevier. →
Blom, A. G., Gathmann, C., & Krieger, U. (2015). Setting up an online panel representative of the general population: The german internet panel. Field Methods, 27(4), 391–408. https://doi.org/10.1177/1525822X15574494. Publisher: SAGE Publications Inc. →
Blom, A. G., Cornesse, C., Friedel, S., Krieger, U., Fikel, M., Rettig, T., Wenz, A., Juhl, S., Lehrer, R., Möhring, K., Naumann, E., Reifenscheid, M., & Mannheim Universität SFB 884 ´Political Economy of Reforms´ (2021). Mannheim corona study. GESIS Data Archive, Cologne. ZA7745 Data file Version 1.0.0. https://doi.org/10.4232/1.13700. →
Blom, A. G., Marisabel Gonzalez Ocanto, Krieger, U., Rettig, T., Ungefucht, M., & Mannheim Universität SFB 884 ´Political Economy of Reforms´ (2022). German internet panel, wave 58 (march 2022). GESIS, Cologne. ZA7878 Data file Version 1.0.0. https://doi.org/10.4232/1.14054. →
Bosnjak, M., Dannwolf, T., Enderle, T., Schaurer, I., Struminskaya, B., Tanner, A., & Weyandt, K. W. (2018). Establishing an open probability-based mixed-mode panel of the general population in germany: The GESIS panel. Social Science Computer Review, 36(1), 103–115. https://doi.org/10.1177/0894439317697949. a, b
Breiman, L. (2001). Random forests. Machine Learning, 45(1), 5–32. https://doi.org/10.1023/A:1010933404324. →
Bujard, M., Gummer, T., Hank, K., Neyer, F. J., Pollak, R., Schneider, N. F., Spieß, C. K., Wolf, C., Bauer, I., Börlin, S., Bretschi, D., Brüggemann, K., Christmann, P., Edinger, R., Eigenbrodt, F., Frembs, L. C., Groß, K., Jost, C., Kunz, T., Lines, E., Lück, D., Naderi, R., Naumann, E., Nutz, T., Oehrlein, A.-S., Oellers, V., Ruckdeschel, K., Schmid, L., Schumann, A., Schumann, N., Stein, A., Thönnissen, C., Ullrich, E., von den Driesch, E., & Weih, U. (2023). Freda – the german family demography panel study (study no. za7777; data file version 2.0.0). https://doi.org/10.4232/1.14065. Accessed: 2024-12-31. →
Cheng, A., Zamarro, G., & Orriëns, B. (2016). Personality as a predictor of unit nonresponse in panel data: An analysis of an internet-based survey. https://doi.org/10.2139/ssrn.2852614. →
Durrant, G. B., & Steele, F. (2008). Multilevel modelling of refusal and non-contact in household surveys: Evidence from six uk government surveys. Journal of the Royal Statistical Society Series A: Statistics in Society, 172(2), 361–381. https://doi.org/10.1111/j.1467-985X.2008.00565.x. →
Federal Institute for Population Research (2022). FReDA. https://www.bib.bund.de/EN/Research/Family/Projects/FReDA-Family-Research-and-Demographic-Analysis.html. Accessed 6 Oct 2022. →
Feurer, M., & Hutter, F. (2019). Hyperparameter optimization. In F. Hutter, L. Kotthoff & J. Vanschoren (Eds.), Automated Machine Learning. The Springer Series on Challenges in Machine Learning. (pp. 3–33). Springer. https://doi.org/10.1007/978-3-030-05318-5_1. →
Fitzgerald, J., Gottschalk, P., & Moffitt, R. (1998). An analysis of sample attrition in panel data: The michigan panel study of income dynamics. National Bureau of Economic Research.. https://doi.org/10.3386/t0220. →
Friedman, J. H. (2001). Greedy function approximation: A gradient boosting machine. The Annals of Statistics, 29(5), 1189–1232. https://doi.org/10.1214/aos/1013203451. Publisher: Institute of Mathematical Statistics. →
Fuchs, M., Bossert, D., & Stukowski, S. (2013). Response rate and nonresponse bias - impact of the number of contact attempts on data quality in the european social survey. Bulletin of Sociological Methodology/Bulletin de Méthodologie Sociologique, 117(1), 26–45. https://doi.org/10.1177/0759106312465547. Publisher: SAGE Publications Ltd. →
German Institute for Economic Research (DIW Berlin) (2023). DIW berlin: SOEP-core v37eu (data 1984-2020, EU-edition). https://www.diw.de/en/diw_01.c.838578.en/edition/soep-core_v37eu__data_1984-2020__eu-edition.html. Accessed 3 Nov 2023. Publisher: DIW Berlin. →
GESIS (2021). GESIS - Leibniz Institute for the Social Sciences. https://www.gesis.org/en/gesis-panel/documentation. Accessed 20 Oct 2023. →
GESIS (2023). GESIS panel - standard edition. Cologne: GESIS. https://doi.org/10.4232/1.13931. ZA5665 Data file Version 44.0.0 a, b
Goebel, J., Grabka, M. M., Liebig, S., Kroh, M., Richter, D., Schröder, C., & Schupp, J. (2019). The german socio-economic panel (SOEP). Jahrbücher für Nationalökonomie und Statistik, 239(2), 345–360. https://doi.org/10.1515/jbnst-2018-0022. →
Hastie, T., Tibshirani, R., & Friedman, J. (2009). The Elements of Statistical Learning. Springer Series in Statistics. Springer. https://doi.org/10.1007/978-0-387-84858-7. →
Hill, C. A., Biemer, P. P., Buskirk, T. D., Japec, L., Kirchner, A., Kolenikov, S., & Lyberg, L. E. (2020). Big Data Meets Survey Science: A Collection of Innovative Methods. John Wiley & Sons. Google-Books-ID: gWP4DwAAQBAJ →
Jacobsen, E., Xinhui, R., Anran, L., Chung-Chou, H. C., & Ganguli, M. (2021). Predictors of attrition in a longitudinal population-based study of aging. International Psychogeriatrics, 33(8), 767–778. https://doi.org/10.1017/S1041610220000447. Publisher: Cambridge University Press. a, b
James, G., Witten, D., Hastie, T., & Tibshirani, R. (2013). An Introduction to Statistical Learning. Springer Texts in Statistics, Vol. 103. Springer. https://doi.org/10.1007/978-1-4614-7138-7. a, b, c
Jankowsky, K., Steger, D., & Schroeders, U. (2022). Predicting lifetime suicide attempts in a community sample of adolescents using machine learning algorithms. https://osf.io/preprints/psyarxiv/sa37x/ a, b
JSSAM Special virtual issue on nonresponse rates and nonresponse adjustments. https://academic.oup.com/jssam/pages/special-virtual-issue-on-nonresponse-rates-and-nonresponse-adjustments →
Kern, C., Klausch, T., & Kreuter, F. (2019). Tree-based machine learning methods for survey research. Survey research methods, 13(1), 73–93. Retrieved October 5, 2022 from https://www.ncbi.nlm.nih.gov/pmc/articles/PMC7425836/. →
Kern, C., Weiß, B., & Kolb, J.-P. (2021). Predicting nonresponse in future waves of a probability-based mixed-mode panel with machine learning. Journal of Survey Statistics and Methodology. https://doi.org/10.1093/jssam/smab009. a, b, c, d
Kocar, S., & Biddle, N. (2022). The power of online panel paradata to predict unit nonresponse and voluntary attrition in a longitudinal design. Quality & Quantity. https://doi.org/10.1007/s11135-022-01385-x. a, b, c, d
Kreuter, F., & Jäckle, A. (2008). Are contact protocol data informative for potential nonresponse and nonresponse bias in panel studies? a case study from the northern ireland subset of the british household panel survey. In first Panel Survey Methods Workshop, Colchester (pp. 14–15). →
Le Cessie, S., & Van Houwelingen, J. C. (1992). Ridge estimators in logistic regression. Journal of the Royal Statistical Society. Series C (Applied Statistics), 41(1), 191–201. https://doi.org/10.2307/2347628. Publisher: [Wiley, Royal Statistical Society]. →
Lemay, M. (2009). Understanding the mechanism of panel attrition. University of Maryland. →
Liebig, S., Goebel, J., Grabka, M., Schröder, C., Zinn, S., Bartels, C., Franken, A., Gerike, M., Geschke, S.-C., Griese, F., Kara, S., König, J., Krause, P., Kröger, H., Liebau, E., Nebelin, J., Petrenz, M., Richter, D., Schupp, J., Siegers, R., Steinhauer, H. W., Wenzig, K., Zimmermann, S., & Deutsches Institut Für Wirtschaftsforschung (DIW Berlin) (2022). Socio-economic panel, data from 1984-2020, (SOEP-core, v37, EU edition). https://doi.org/10.5684/soep.core.v37eu. Version Number: v37 →
Lipps, O. (2007). Attrition in the swiss household panel. Methoden, Daten, Analysen (mda), 1(1), 45–68. Retrieved from https://www.ssoar.info/ssoar/handle/document/12644. →
Lipps, O. (2009). Attrition of households and individuals in panel surveys. SSRN Electronic Journal. https://doi.org/10.2139/ssrn.1367371. →
Lugtig, P. (2014). Panel attrition: Separating stayers, fast attriters, gradual attriters, and lurkers. https://journals.sagepub.com/doi/10.1177/0049124113520305. Accessed 5 Oct 2022. a, b
Luiten, A., Hox, J., & de Leeuw, E. (2020). Survey nonresponse trends and fieldwork effort in the 21st century: Results of an international study across countries and surveys. Journal of Official Statistics, 36(3), 469–487. https://doi.org/10.2478/jos-2020-0025. →
Lynn, P., Cabrera-Álvarez, P., & Clarke, P. (2023). Sample composition and representativeness on understanding society. Fiscal Studies, 44(4), 341–359. https://doi.org/10.1111/1475-5890.12357. →
McLauchlan, C., & Schonlau, M. (2016). Are final comments in web survey panels associated with next-wave attrition? Survey Research Methods, 10, 211–224. https://doi.org/10.18148/SRM/2016.V10I3.6217. →
Minderop, I., & Weiß, B. (2023). Now, later, or never? using response-time patterns to predict panel attrition. International Journal of Social Research Methodology, 26(6), 693–706. https://doi.org/10.1080/13645579.2022.2091259. →
Mulder, J., & Kieruj, N. (2018). Preserving our precious respondents: Predicting and preventing non-response and panel attrition by analyzing and modeling longitudinal survey and paradata using data science techniques a, b, c, d
Oh, S. (2022). Predictive case-based feature importance and interaction. Information Sciences, 593, 155–176. https://doi.org/10.1016/j.ins.2022.02.003. →
Olson, K. (2013). Paradata for nonresponse adjustment. The ANNALS of the American Academy of Political and Social Science, 645(1), 142–170. https://doi.org/10.1177/0002716212459475. →
Pforr, K., & Schröder, J. (2016). Why panel surveys? SDM-Survey Guidelines (GESIS Leibniz Institute for the Social Sciences). https://doi.org/10.15465/GESIS-SG_EN_008. Version Number: 2.0 →
Plewis, I., & Shlomo, N. (2017). Using response propensity models to improve the quality of response data in longitudinal studies. Journal of Official Statistics, 33(3), 753–779. https://doi.org/10.1515/jos-2017-0035. →
Roßmann, J., & Gummer, T. (2016). Using paradata to predict and correct for panel attrition. Social Science Computer Review, 34(3), 312–332. https://doi.org/10.1177/0894439315587258. Publisher: SAGE Publications Inc. →
Saarela, M., & Jauhiainen, S. (2021). Comparison of feature importance measures as explanations for classification models. SN Applied Sciences, 3(2), 272. https://doi.org/10.1007/s42452-021-04148-9. →
Siegers, R., Steinhauer, H. W., & Dührsen, L. (2021). SOEP-core v36 – documentation of sample sizes and panel attrition in the german socio-economic panel (SOEP) (1984 until 2019) (p. 118). a, b
Tibshirani, R. (1996). Regression shrinkage and selection via the lasso. Journal of the Royal Statistical Society. Series B (Methodological), 58(1), 267–288. Retrieved January 8, 2024, from https://www.jstor.org/stable/2346178. →
Uhrig, S. C. N. (2008). The nature and causes of attrition in the british household panel survey →
Voorpostel, M., & Lipps, O. (2011). Attrition in the swiss household panel: Is change associated with drop-out? Journal of Official Statistics, 18., . →
Zinn, S., & Gnambs, T. (2022). Analyzing nonresponse in longitudinal surveys using bayesian additive regression trees: A nonparametric event history analysis. Social Science Computer Review, 40(3), 678–699. https://doi.org/10.1177/0894439320928242. a, b, c