Self-rated health (SRH) is one of the most frequently used health measures (Garbarski, Dykema, Croes, & Edwards, 2017). Its popularity can be explained by its brevity and ease of use (Au & Johnston, 2014) as well as its predictive validity of morbidity and mortality (Bailis, Segall, & Chipperfield, 2003; Idler & Benyamini, 1997). To assess SRH, a single item is usually administered asking about respondents’ health status on a 5-point fully-labeled response scale without further instructions on what aspects to consider, e.g., “How is your health in general?” or “How would you rate your health in general?”. The undefined scope of the SRH item has been termed an “important benefit and drawback” simultaneously (Garbarski, 2016, p. 978). Respondents can freely decide which aspects to include in their judgment to assess their health. However, it can be challenging for respondents to understand the construct of health as intended, infer the meaning of response options, and map their health status to the response options provided (Lee & Schwarz, 2014). Researchers do not know in detail what the respondents considered when assessing their health and how they formed their judgment (Garbarski, 2016; Lee et al., 2020). Thus, the undefined scope carries the risk that the validity and reliability of SRH is impaired. Moreover, respondents with objectively differing health status can select the same response option or vice versa. Against this backdrop, qualitative pretesting methods, such as thinking aloud and probing (Presser et al., 2004), can help to uncover the mental processes of respondents while answering (Miller, Willson, Chepp, & Padilla, 2014) and thus establish the content-related validity of this construct.
The SRH item is asked in many national and cross-national surveys such as the Survey of Health, Ageing and Retirement in Europe (SHARE), the International Social Survey Programme (ISSP), the European Social Survey (ESS), or the World Values Survey (WVS), but often in (slightly) different versions. The versions vary in wording of the item text but also in terms of the set of response options used (e.g., “excellent” to “poor;” “very good” to “very bad”), and whether they represent a balanced set of positive and negative response options (“very good, good, fair, bad, very bad;” WHO version) or not (“excellent, very good, good, fair, poor;” US version). Such variations in measurement may hinder comparisons across surveys—and within surveys when survey items change over time (Cullati et al., 2020). To compare survey instruments from different source surveys, it is necessary to ensure the comparability of these instruments by addressing three areas: First, validity or construct match, which involves ensuring that the different source instruments measure the same construct. Second, differences in reliability, as different source instruments may have different levels of random measurement error. Third, units of measurement, which addresses the issue that different instruments (e.g., using different response scale labels) may map the same true construct intensity onto different numerical values (Singh & Quandt, 2023). Up to now, little attention has been given to the effect and comparability of response scale labels on assessing SRH (Garbarski, 2016).
Respondents use the response scale labels to interpret questions, and their evaluations may change depending on the scale used (e.g., how the scale end-points are labelled). Hence, how response options are labelled might affect respondents’ understanding and, thus, their response behavior as they use the meaning of the labels to map their health status to the response options given (Lee et al., 2020; Rohrmann, 2007). Researchers should therefore try to label response options in a way that represents equidistance between them (Krosnick, 1999). When assessing one’s health status, the labels used should be interpreted in the same way across respondents (at least in the same cultural context) to make them comparable. Moreover, when comparisons are made, respondents with similar health should be represented with the same numerical value to ensure the coefficients are comparable (Kolen & Brennan, 2014; Rohrmann, 1978).
This study compares four five-point scale versions of SRH (in the German language) that are used in four different German surveys. The scales differ in terms of symmetry, that is, whether they have a balanced or unbalanced number of positive and negative response options, and in the verbal labels used. The scales of the European Social Survey (ESS), the GESIS Panel, and the ALLBUS are all balanced scales with two positive response options, one middle category, and two negative response options. The labels of the two positive response options are identical, while the middle category is labelled differently (see Table 1 for the exact wording of the scale labels). In contrast, the scale used by the International Social Survey Programme (ISSP; and also by the Survey of Health, Ageing and Retirement in Europe, SHARE) is an asymmetrical or unbalanced scale with three response options indicating good health, one middle category, and one category for assessing negative health. Due to the asymmetry, the middle category as the conceptual midpoint of the scale does not coincide with the visual midpoint. The most positive category is labeled as “excellent”, while the second positive category is labeled as “very good”, which corresponds to the most positive category of the three balanced scales. When combining the varying SRH instruments into one data set or comparing them across surveys, it is important to ensure the comparability of the measurement units. Ideally, respondents with a score of “3” should be very similar in their assessment of their health, regardless of the instrument used. Our study has the following objectives: First, to assess the impact of response scale labels on the distribution of the SRH item. Second, to examine how respondents understand the verbal scale labels and to investigate what health aspects respondents have in mind that drive their response behavior. What aspects do respondents take into account that lead to judging their health as “very good” or “poor?” We are particularly interested in learning whether patterns of interpretation are stable for (numerical and/or verbal) scale points across the experimental conditions. To answer our research questions, we complement the quantitative analyses with qualitative data to understand the underlying response process. We conducted a web survey using a non-probability sample via an online access panel in which we implemented an open-ended cognitive probing question that followed the SRH item. The probe asked respondents to elaborate on their selected response option (Behr et al., 2017). Probes are a way of asking among the cognitive interviewing techniques and are used to understand what respondents think while answering survey questions (Miller et al., 2014). In-person cognitive interviewing is a qualitative, in-depth approach with typically small sample sizes (Willis, 2005). The method of web probing implements cognitive probing techniques in web surveys. Due to the larger sample sizes of web surveys, probe responses collected in web probing studies are particularly useful for the assessment of validity and comparability of survey measures (Behr et al., 2017; Fowler & Willis, 2020). Like in cognitive interviewing studies, the probe responses are analyzed qualitatively using coding schemes (Willis, 2015).
Table 1 Experimental scale versions (German and original English survey source/translations)
Scale | 1—ISSP1 | 2—ESS | 3—GESIS Panel2 | 4—ALLBUS |
(unbalanced) | (balanced) | (balanced) | (balanced) | |
1 Equivalent to the scale used in SHARE 2 Equivalent to the GEDA 2014/2015 scale (RKI, 2018) 3 The English ISSP and ESS versions are in fact source versions, and the resulting German response scales are translations thereof | ||||
German original | ||||
1 | Ausgezeichnet | Sehr gut | Sehr gut | Sehr gut |
2 | Sehr gut | Gut | Gut | Gut |
3 | Gut | Durchschnittlich | Mittelmäßig | Zufriedenstellend |
4 | Mittelmäßig | Schlecht | Schlecht | Weniger gut |
5 | Schlecht | Sehr schlecht | Sehr schlecht | Schlecht |
English source/translation3 | ||||
1 | Excellent | Very good | Very good | Very good |
2 | Very good | Good | Good | Good |
3 | Good | Average | Fair | Satisfactory |
4 | Fair | Bad | Bad | Less good |
5 | Poor | Very bad | Very bad | Poor |
The method of web probing allows us to use respondents’ own explanations and the health aspects they have in mind when assessing their health as “very good” or “poor” without being limited to the usually relatively small case numbers of cognitive interviews (Behr et al., 2017).
Previous research revealed that respondents consider different factors when rating their health using the SRH item. According to Garbarski (2016), there are four dimensions that influence SRH: (1) health, (2) psychological, (3) social, and (4) survey measurement factors (see Garbarski, 2016, for the detailed framework on the measurement of health). The health dimension consists of health conditions, health behaviors, physical functioning, health care, and health knowledge. Respondents also take factors related to their environment as well as temporal dimensions into account.
Psychological factors include aspects such as mental health or expectations of the future, as well as personality traits or cognitive abilities. Psychological factors also include aspects of the response process per se, i.e., how respondents comprehend a question, how they retrieve information from memory, how they form a judgment based on this information, and how they select and report an answer (Garbarski, 2016; Tourangeau, Rips, and Rasinski, 2000).
Social factors associated with health are social characteristics such as gender, age, indicators of socioeconomic status, or marital status. Furthermore, these social characteristics might result in differences in evaluative frameworks, for instance, which comparison group or which factors one uses to come up with a health rating.
The survey measurement factor relates to how the question of SRH is measured. As indicated in the introduction, several versions of the SRH item are available, which differ in question wording, scale labels, and response format. Additionally, the definition of health and the aspects that come to mind may differ between respondents depending on the factors described above. Moreover, when people assess their health status, they can adopt multiple temporal perspectives, often in parallel: On the one hand, health is often perceived as a stable condition, which is thus independent of short-term illnesses or complaints. On the other hand, however, immediate aspects of health (e.g., current diseases) can drive the response behavior (Lee, 2014).
Responses to items measuring SRH are affected by order and response scale labelling. Jürges and colleagues (2008) compared two versions of the SRH item across five countries by using SHARE (2004) data. Respondents rated their health once using the SRH version of the WHO, ranging from “very good” to “very bad” and once the US version, ranging from “excellent” to “poor.” The WHO version uses a balanced response scale with two negative, two positive, and one neutral scale point, while positive categories predominate in the US version. By comparing intra-individual responses, differences in the reporting of SRH were revealed, particularly a more balanced distribution and better response discrimination in the US version overall, but a better discrimination at the negative end of the response scale with the WHO version. As respondents in this study answered both the US and the WHO versions, their responses could be compared. Respondents were more likely to answer verbally consistently the US and WHO version (e.g., respondent answers “very good” on both scales) than in terms of their relative position on the SRH scales (e.g., the top category). A second study focusing on the above-mentioned US version to measure SRH examined cross-country differences in SRH in ten European countries. The findings showed that SRH distributions vary a lot across countries due to different use and connotations of extreme categories (such as “excellent”) and general differences in response styles, i.e., the tendency to (not) select extreme points of a response scale. While more than 40 % of respondents in Denmark and Sweden reported being in “excellent” health, respondents in Germany and Spain selected this extremely positive response option less often (and thereby systematically underestimated their health in comparison to other countries; Jürges, 2007).
Two studies by Garbarski and colleagues (2015, 2016) examined response order effects. They found that health is rated better when the response options are ordered from positive to negative (e.g., “excellent” to “poor”) than from negative to positive. The authors also observed that health assessments differed when the SRH item followed a list of domain-specific health items than if respondents answered them after the SRH item (Garbarski et al., 2015).
A cognitive interviewing study with 40 subjects studied what aspects respondents consider when assessing their health. This study only assessed one scale version. The response options of the scale were labeled as “very good, good, fair, sometimes fair and sometimes poor, and poor.” Respondents were asked to explain their selected responses. The authors identified five health dimensions, namely physical, functional abilities or limitations, coping, wellbeing, and behavior, with the physical dimension being the one mentioned most often (by 78% of respondents). Differentiating between respondents being in good health (combining the response options “very good” and “good”) and respondents in “less than good health” (combining the response options “fair,” “sometimes good and sometimes poor,” and “poor”) revealed that the functional dimension as well as the coping dimension are more relevant for the latter group although differences were not statistically significant. Participants mentioned on average 1.6 dimensions, with an average of 1.4 health dimensions by participants with (very) good health and 2.0 health dimensions by respondents in poorer health conditions (Simon et al., 2005).
Overcoming the comparable small sample sizes of qualitative studies, Lee et al. (2020) used web probing to compare the SRH item and self-rated life expectancy in terms of nonresponse rates, response times, and health aspects respondents consider across five countries. SRH was measured either on a 5-point fully-labelled or on a 101-point endpoint-labelled scale. The 5‑point scale SRH item version was “Would you say your health is excellent, very good, good, fair, or poor in general?” The SRH item using the 101-point scale was “On a scale from 0 to 100, where 0 is worst possible health and 100 is perfect possible health, how would you rate your health in general? Please provide the number from 0 to 100 below”. The main attributes mentioned—illness, comments related to general health and health behaviors—did not differ by scale version, while response times were longer when answering on the 101-point scale. In sum, several studies have investigated which health factors and dimensions respondents consider when answering questions about their health.
In this study, we compare, for the first time, four different existing German versions measuring SRH and implement web probing to question respondents directly about their reasons for selecting a particular response option. We combine qualitative and quantitative methods to examine: (1) Whether the response scale design has an influence on respondents’ answers; (2) Whether it influences the number of associations when answering; and (3) the aspects respondents consider when answering the SRH item. Particularly, do they interpret the verbal labels differently, or do respondents who select “very good” have the same associations in mind, although the scales differ?
We evaluate response behavior and comparability of the scales in terms of answer distributions (response frequency and means), response styles, and respondents’ associations with the response option selected. Investigating respondents’ associations, we examine whether the response scale design affects types and number of themes and whether differences in scale labeling (e.g., how the first response option is labeled) change the evaluative nature of the response scale and the meaning of the verbal labels (or response options). Besides coding and analyzing the themes respondents consider, we also code the tone associated with each theme (i.e., whether respondents mention positive or negative health aspects). We postulate the following hypotheses:
We expect no significant differences between the answer distributions of balanced scales (such as the ESS, GESIS Panel, and ALLBUS scales) (Hypothesis 1a), but we expect significant differences in answer distributions between the balanced and the unbalanced scales (Hypothesis 1b), with less differentiation of the unbalanced ISSP scale at the lower end and more differentiation at the upper end of the scale. We expect that respondents rate their health status as lower when the first response option is labeled as “excellent” than when it is labeled as “very good” due to a decrease in extreme responding (Hypothesis 2a) and an increase in middle responding (Hypothesis 2b).
For the effect of the verbal labels and position of the response options in the scale, we propose two opposing hypotheses. If the position in a scale is interpreted independently of the verbal labels, the position in the scale is decisive, and associations and tone for the numerical scores of the five-point scales should be more or less comparable across SRH versions (Hypothesis 3a). If there is a hierarchy of characteristics that respondents consider when answering, with verbal labels being more important than numerical position, as suggested by Tourangeau, Couper and Conrad (2007), the associations and tone of the respondents should be more different in case the labels are different, or more similar in case the labels are identical but the position in the scale is different (Hypothesis 3b).
Data was collected with the German nonprobability online access panel of the Respondi AG (now Bilendi; Neuert et al., 2025). The web survey was fielded between November 27 and December 6, 2019 and used quotas for sex and age (18–30; 31–50; 51 and older). Completing the web survey took an average of 6.46 min (median = 4.57). The experiment reported here was included at the end of the questionnaire. Overall, 1710 panelists answered the questions. From 1925 respondents who started the survey, 1717 respondents got to the introductory page of our experiment, of which seven respondents dropped out during the experiment, resulting in a completion rate of 99.6% (AAPOR RR6, AAPOR, 2010; Callegaro & DiSogra, 2008). Of those, half described themselves as female (50%) and male (50%), respectively, two did not identify with binary gender, and mean age was 41 years.1 We varied the wording of the scale labels of the SRH item leading to four experimental treatment groups of approximately equal size (condition 1: n = 420, condition 2: n = 428, condition 3: n = 406, condition 4: n = 456). Respondents were randomly assigned to these. The response scales used originate from established survey programs, for the exact wording of scale versions, see Table 1. In order to ensure that the question wording did not influence the responses or construct comparability, we kept the formulation of the SRH question identical across all four conditions (“In general, how would you rate your health?”).
The response options were presented vertically on the screen. Following the SRH item, respondents were asked to elaborate on their response on the following survey page. The category-selection probe read as “Please explain your answer in more detail. Why did you choose this answer?”. By following directly on the next survey page, it should be ensured that respondents’ thought processes are still available in short-term memory (Willis 2005).
We conducted chi-square tests and analyses of variance to check if sociodemographic characteristics differed significantly across the experimental groups, which was not the case for sex, χ2 (df = 6, N = 1710) = 6.45, p = 0.374, and age, F (df = 3, N = 1710) = 0.68, p = 0.563.
Analytical strategy: All analyses were conducted with Stata 18. To evaluate the effect of the experimental treatments on SRH, we conducted chi-square tests to compare frequency distributions of the responses and analyses of variance (F-tests) as well as Bonferroni corrected pairwise comparisons for differences in means. As SRH was rated on a scale from 1 = “excellent/very good health” to 5 = “poor/very bad health”, lower values indicate better self-reported health. As response styles, we compare the probability to select the most positive response option “1” (referred to as extreme response style) as well as the visual midpoint (middle response option “3”).
Coding of probing responses: The coding scheme for SRH consisted of 11 core themes or main associations respondents had in mind when answering the SRH item. It was based on coding schemes from Groves et al. (1992) and Lee et al. (2020) and further refined for our purpose based on the answers given in response to our probe. We utilized the following 14 codes for probing responses:
Health behaviors (e.g., behavior related to diet/nutrition such as being overweight; smoking or drinking; exercise; sleep),
health problems or conditions general (when no specific health problem or condition is mentioned, e.g., “I am always sick”),
health problems or conditions specific (when a response includes specific problems or conditions; e.g., diabetes, digestive issues),
health service usage (e.g., doctors’ visits, checkups, medication),
activities of daily living or how limited respondents are in carrying these out,
mental health (e.g., stress, depressive symptoms, diagnosed depression, anxiety),
pain (e.g., back pain),
temporarily health conditions (coded when respondents stress their current health situation; e.g., having a cold),
chronic diseases (e.g. “I am diagnosed with chronic obstructive pulmonary disease”),
reported handicaps,
general health comments indicating no specific reasons (e.g., “I am healthy,” “I have been better”),
societal/demographic reasons or comparisons (e.g., “I am very fit and healthy for my age,” “I am young”),
life situation (e.g., stressful job, being pregnant), and
insufficient knowledge about own health status (e.g., “You never know,” “I am not aware of any illnesses”).
Most of the main categories contained more detailed sub-categories, which were condensed into the main categories to allow for comparisons in the analyses. We assigned up to eight codes per respondent, which was hardly ever used, though. Besides themes, each response was given a second tone code. The tone indicated whether respondents mentioned only positive (e.g., “I don’t smoke, rarely drink alcohol and exercise regularly”), only negative (e.g., “I eat rather unhealthy and do too little sport”), or neutral aspects of health (e.g., either neither negative nor positive “change of diet,” “exercise”; or both positive and negative aspects; e.g., “I eat a healthy diet, but I should do more sport”).
Two authors coded each half of the responses (i.e., each coded two scale versions), and a further subset of ten percent of the answers was double-coded to determine agreement across coders. Holsti’s reliability coefficient was 0.89. Discrepancies were discussed, and final codes were assigned together. A definition of all categories with several example codes can be found in the Online Supplement. We excluded cases where respondents left the probing answer blank or did not answer it meaningfully, which occurred in 13% of cases. Probe nonresponse was not significantly different across conditions, χ2 (3) = 4.24, p = 0.237. The majority of responses (60%) were assigned one code, 25% two codes, while the remaining 15% were given more than two codes. We report the content of the first code for each respondent for a clearer illustration in the results section.
Considering the top two categories (scale point one and two) per scale, respondents appear to be in better health when answering the three balanced versions compared to the unbalanced, i.e., the ISSP scale (see Table 2). However, if we focus on respondents who rated their health literally as “very good” or even better, the picture is reversed. Whereas 39% reported to be in “excellent” or “very good” health (top two categories) in response to the ISSP scale, between 12% and 17% reported “very good health” (the top category) in response to the three other versions (Table 2).
Table 2 Response distribution of the SRH item, by scale version
Scale | (1) ISSP (unbalanced) | (2) ESS (balanced) | (3) GESIS Panel (balanced) | (4) ALLBUS (balanced) | ||||
% | n | % | n | % | n | % | n | |
1 excellent/very good/very good/very good | 10 | 40 | 12 | 53 | 17 | 69 | 14 | 64 |
2 very good/good/good/good | 29 | 123 | 44 | 189 | 48 | 194 | 45 | 207 |
3 good/fair/moderately/satisfactory | 35 | 148 | 33 | 140 | 26 | 106 | 25 | 112 |
4 fair/bad/bad/less good | 21 | 87 | 9 | 39 | 7 | 30 | 13 | 57 |
5 poor/very bad/very bad/poor | 5 | 22 | 2 | 7 | 2 | 7 | 4 | 16 |
Total | 420 | 428 | 406 | 456 | ||||
Chi2-Test | χ2 (12) = 89.21, p < 0.001 | |||||||
In a next step, we differentiated between respondents assessing their health as good or poor. For the unbalanced ISSP scale, respondents assessed their health as good if they selected one of the three response options “excellent,” “very good,” or “good.” For the three balanced scales, a good health status encompassed the two response categories “very good” and “good”. On the opposite side of the scale, a poor health status contained the response option “poor” on the unbalanced ISSP scale and combined “bad/less good” and “very bad/poor” on the balanced scales. The proportion of respondents reporting a good health status is higher when answering with the ISSP scale compared to the three other scales, while the proportion of respondents reporting a poor health status is lower. In the ISSP version, 5% of respondents rated their health as “poor,” whereas 16% in the ALLBUS version, 11% in the ESS version, and 9% of participants in the GESIS Panel version selected to describe their health as poor (the two bottom categories).
We expected no differences between the answer distributions of the balanced scales (Hypothesis 1a), while we expected differences between the balanced scales and the unbalanced ISSP scale (Hypothesis 1b). To test our hypotheses on the answer distributions of the four scale versions, we conducted chi-square tests. Response distributions differed significantly across conditions. Pairwise chi-square tests revealed statistically significant differences between the ISSP scale and all three other balanced scales (ISSP vs ESS: χ2 (4) = 41.97, p < 0.001; ISSP vs GESIS Panel: χ2 (4) = 65.87, p < 0.001; ISSP vs ALLBUS: χ2 (4) = 37.69, p < 0.001), confirming hypothesis 1b). Furthermore, pairwise chi-square tests also uncovered significant differences between ESS and ALLBUS (χ2 (4) = 10.98, p = 0.027) and GESIS Panel and ALLBUS scales (χ2 (4) = 9.81, p < 0.044), respectively, which is in contrast to hypothesis 1a). Response distributions did not differ between the ESS and the GESIS Panel scales (χ2 (4) = 7.46, p = 0.113).
With regard to the mean ratings of the SRH item, we found statistically significant differences across conditions (F = 24.06; p < 0.001, η2 = 0.04; see Table 3). When applying the Bonferroni correction, differences in means were significantly different between the scales used in the ISSP and ESS (p < 0.001, mean difference = 0.39), ISSP and GESIS Panel (p < 0.001, mean difference = 0.54), and ISSP and ALLBUS (p < 0.001, mean difference = 0.37), confirming Hypothesis 2a), that health is assessed lower when the first response option is labeled as “excellent.” Table 3 details the mean health ratings by scale version as the proportion of the most positive responses (scale value “1”) and visual midpoint responses (scale value “3”). As expected, fewer respondents selected the most positive option when it was labeled as “excellent” compared to “very good,” although the differences were only statistically significant between the ISSP and the GESIS Panel and ALLBUS scales, respectively (and not between ISSP and ESS scales).
Table 3 Means and extreme responses of the SRH item and number of associations, by scale version
Scale | (1) ISSP | (2) ESS | (3) GESIS Panel | (4) ALLBUS | Valuec | p | n |
a) As the response option to assess SRH as “excellent/very good” is coded with “1”, lower mean values indicate higher self-reported health. b) Superscripts 1–4 indicate significant differences of pairwise comparisons between conditions (a) ISSP to (d) ALLBUS (α = 0.05); c) F-value for continuous variables, Pearson’s chi-square value for categorical variables | |||||||
SRH (mean) | 2.832,3,4 | 2.431 | 2.291 | 2.461 | 24.06 | 0.001 | 1710 |
Most positive response option (%) | 103, 4 | 12 | 171 | 141 | 10.57 | 0.014 | 226 |
Midpoint responses (%) | 353, 4 | 333, 4 | 261, 2 | 251, 2 | 16.33 | 0.001 | 506 |
Number of associations/themes (mean) | 1.59 | 1.64 | 1.57 | 1.69 | 1.27 | 0.283 | 1490 |
– scale point 1 | 1.43 | 1.63 | 1.68 | 1.64 | 0.69 | 0.559 | 206 |
– scale point 2 | 1.55 | 1.63 | 1.52 | 1.62 | 0.52 | 0.668 | 608 |
– scale point 3 | 1.55 | 1.56 | 1.49 | 1.57 | 0.17 | 0.915 | 442 |
– scale point 4 | 1.72 | 1.97 | 1.96 | 2.23 | 2.00 | 0.116 | 193 |
– scale point 5 | 1.83 | 2.00 | 1.33 | 1.69 | 0.42 | 0.741 | 41 |
Similarly, the number of respondents selecting the middle value of the scale (the visual midpoint)—irrespective of the label—was significantly higher for the ISSP and ESS scales compared to the GESIS Panel and ALLBUS scales. Hypothesis 2b, that middle responding (only) increases when the first option is “excellent”, cannot be fully confirmed.
Before investigating which aspects respondents considered and whether they used different tones, we compared whether the response scale design affected the number of associations respondents had in mind. As shown in the lower part of Table 3, respondents mentioned a comparable number of themes across response scales, namely about 1.6 themes. Comparing the mean number of associations by the response given (the numeric response option) showed no statistically significant differences.
Table 4 summarizes the aspects respondents considered when answering the SRH item. Overall, we found no statistically significant differences in health aspects mentioned across scale versions (χ2 (42) = 44.02, p = 0.386). The two most frequent codes across all four scale versions referred to general health problems or conditions (25%) without mentioning specific health problems or conditions (e.g., “I have no illnesses and am in perfect health”), and respondents making general health comments (e.g., “My health is good”; 18%).
Table 4 Relative and absolute frequencies of aspects considered overall, by scale version
Aspects considered | % | n | ||||||||
(1) ISSP | (2) ESS | (3) GESIS Panel | (4) ALLBUS | Total | (1) ISSP | (2) ESS | (3) GESIS Panel | (4) ALLBUS | Total | |
1—Health behavior | 10 | 14 | 11 | 11 | 12 | 36 | 55 | 40 | 44 | 175 |
2—Health problems general | 24 | 25 | 26 | 27 | 25 | 86 | 95 | 90 | 106 | 377 |
11—Health general comment | 17 | 19 | 17 | 17 | 18 | 62 | 74 | 60 | 66 | 262 |
12—Societal/Demographic factors | 11 | 12 | 9 | 10 | 11 | 40 | 44 | 32 | 40 | 156 |
3—Health problems specific | 8 | 10 | 10 | 12 | 10 | 28 | 37 | 36 | 48 | 149 |
9—Chronic diseases | 6 | 5 | 7 | 8 | 6 | 22 | 18 | 23 | 30 | 93 |
8—Temporality health factors | 7 | 3 | 5 | 3 | 4 | 24 | 12 | 16 | 10 | 62 |
4—Health service usage | 5 | 3 | 3 | 2 | 3 | 16 | 11 | 11 | 9 | 47 |
7—Pain | 2 | 3 | 3 | 4 | 3 | 8 | 13 | 10 | 14 | 45 |
6—Mental health | 3 | 3 | 3 | 2 | 3 | 10 | 10 | 9 | 9 | 38 |
13—Life situation | 2 | 2 | 2 | 2 | 2 | 7 | 6 | 7 | 7 | 27 |
5—ADL | 3 | 0 | 1 | 2 | 2 | 9 | 1 | 5 | 7 | 22 |
10—Handicap | 1 | 1 | 1 | 1 | 1 | 5 | 2 | 4 | 5 | 16 |
14—Insufficient knowledge about health | 0 | 0 | 1 | 0 | 0 | 0 | 1 | 2 | 2 | 5 |
98—other | 1 | 1 | 2 | 0 | 1 | 3 | 4 | 8 | 1 | 16 |
Total | 100 | 100 | 100 | 100 | 100 | 356 | 383 | 353 | 398 | 1490 |
The third most frequently mentioned aspect overall was coded as health behavior (12%). Considering the individual scales, it was mentioned as the fourth most frequent aspect by ALLBUS scale (11%) and ISSP scale (10%) respondents. Respondents answering on the ISSP scale mentioned societal/demographic factors (11%) and respondents answering on the ALLBUS scale mentioned specific health problems (12%) slightly more often than health behavior.
Regarding the tone of the first coded theme, we also found no statistically significant differences across scale versions (χ2 (6) = 8.45 p = 0.207). Overall, around 40 to 45 % of the themes/health aspects were coded as positive or negative, respectively, while the remaining 10 to 15 % were coded as neutral.
Examples of responses mentioning multiple health behaviors (all with a positive tone) of two respondents who selected the second top response option labeled as “good” were “Compared to other people, I don’t suffer from any serious illnesses. I have no chronic or incurable illnesses, no allergies, feel mentally stable and am physically fit. So I’m doing well. Nevertheless, it could be better.” and “Young, active in sports, no genetic health predispositions.” In contrast, an example response for aspects with negative tones of a respondent who selected the middle category on the ESS scale was: “High blood pressure and arteriosclerosis, as well as sleep disorders and obesity, reduce a state of health that is usual characterized by robustness.”
Next, we analyzed whether respondents who selected “very good” had the same associations in mind when answering although the scale values and the position in the scale differed (see Table 5). Again, we observed no major differences (χ2 (36) = 42.92, p = 0.199) across scales. When “very good” was the second response category, the proportion of respondents mentioning health behavior was slightly lower than when it was the first response option (ISSP: 13% compared to ESS: 25%; GESIS Panel: 19%; ALLBUS: 17%). In contrast, societal/demographic factors (ISSP: 9% compared to ESS: 4%; GESIS Panel: 2%; ALLBUS: 5%) and temporal health factors were mentioned more often (ISSP: 8% compared to ESS: 2%; GESIS Panel: 2%; ALLBUS: 0%). Mental health (2%) and pain (3%) were also mentioned by respondents answering on the ISSP scale, while these aspects were not mentioned by respondents assessing their health as “very good” in either of the other three conditions.
Table 5 Relative and absolute frequencies of aspects considered for the scale label “very good”, by scale version
Aspects considered | % | n | ||||||||
(1) ISSP | (2) ESS | (3) GESIS Panel | (4) ALLBUS | Total | (1) ISSP | (2) ESS | (3) GESIS Panel | (4) ALLBUS | Total | |
1—Health behavior | 13 | 25 | 19 | 17 | 17 | 13 | 12 | 12 | 10 | 47 |
2—Health problems general | 35 | 37 | 43 | 34 | 37 | 35 | 18 | 27 | 20 | 100 |
3—Health problems specific | 2 | 0 | 2 | 3 | 2 | 2 | 0 | 1 | 2 | 5 |
11—Health general comment | 18 | 25 | 21 | 24 | 21 | 18 | 12 | 13 | 14 | 57 |
12—Societal/Demographic factors | 9 | 4 | 2 | 5 | 6 | 9 | 2 | 1 | 3 | 15 |
8—Temporality health factors | 8 | 2 | 2 | 0 | 4 | 8 | 1 | 1 | 0 | 10 |
9—Chronic diseases | 2 | 2 | 5 | 9 | 4 | 2 | 1 | 3 | 5 | 11 |
4—Health service usage | 3 | 0 | 2 | 7 | 3 | 3 | 0 | 1 | 4 | 8 |
6—Mental health | 2 | 0 | 0 | 0 | 1 | 2 | 0 | 0 | 0 | 2 |
13—Life situation | 1 | 2 | 0 | 0 | 1 | 1 | 1 | 0 | 0 | 2 |
5—ADL | 2 | 2 | 2 | 2 | 2 | 2 | 1 | 1 | 1 | 5 |
7—Pain | 3 | 0 | 0 | 0 | 1 | 3 | 0 | 0 | 0 | 3 |
98—other | 1 | 2 | 5 | 0 | 2 | 1 | 1 | 3 | 0 | 5 |
Total | 100 | 100 | 100 | 100 | 100 | 99 | 49 | 63 | 59 | 270 |
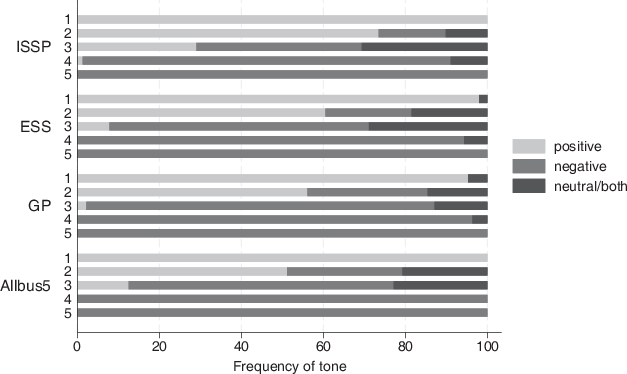
As we want the SRH response categories to differentiate health, we next examined the tone associated with the (numerical) response option selected by respondents. As shown in Fig. 1, respondents assessing their health with the top category (scale value one) mainly mentioned aspects with a positive tone (98%) and only very few with a neutral tone (2%). Respondents answering with the ISSP and ALLBUS scale mentioned only aspects that were coded as having a positive tone. Respondents assessing their health as “very good” in the other two conditions also mentioned aspects that indicated neutral health aspects.
Comparing the tone of respondents who assessed their health as “very good”—independent of being the top health category or the second response option—revealed that although the themes were very similar, as shown in Table 4, the connotation of the probe responses differed depending on the position in the scale (χ2 (6) = 42.06, p < 0.001). When “very good” was the second response option, as in the ISSP scale, 16% of respondents gave probe responses indicating negative health aspects, while this was not the case when “very good” was the top health response option, as in the other three scales. For example, respondents referred to (current) illnesses or impairments due to age (e.g., “Generally very fit, but suffering from a cold”; “Because apart from colds, I’m never really ill”). One respondent explained why they had not selected the top category: “My health seems to be rather good, only chronic illnesses such as my migraines make me feel less well at times, which is why I have opted for ‘very good’ instead of ‘excellent’.”
Comparing the tone for scale points two (labeled as “very good” on the ISSP scale and “good” on the other three scales) and three (coinciding the visual midpoint; labeled as “good” on the ISSP scale and as middle category on the three other scales) showed more responses coded with a positive tone and less with a negative tone for the ISSP scale compared to the other scales (see Fig. 1).
Comparing the tone for all response options labelled as “conceptual midpoint” (scale point four on the ISSP scale and scale point three on the three other scales) showed that 89% of the health aspects mentioned by respondents answering on the ISSP scale and 85% on the GESIS Panel scale were coded as negative compared to 63% on the ESS and 65% on the ALLBUS scale. Notably, the conceptual middle response option is labeled as “fair” (“mittelmäßig”) in both the ISSP and GESIS Panel scale while it is labeled as “average” (“durchschnittlich”) and “satisfactory” (“zufriedenstellend”) in the other two scales.
On the other pole of the scale, which reflects a poor health status (scale point five), respondents across all conditions named aspects indicating only a negative health status.
The first objective of this study was to examine whether response scale designs have an influence on respondents’ answers. Differences in answer distributions and means suggested that the scale versions, particularly balanced and unbalanced scales, are not comparable. The response distributions indicate that the same verbal response labels elicited different assessments, particularly between the unbalanced ISSP scale and the three other balanced scale versions. The second objective was to examine the number of associations respondents have. Considering the number of aspects respondents mentioned, no differences across scale versions were observed. The third objective was to determine what aspects respondents consider when answering the SRH item and how they interpret the verbal labels to understand the survey data in more detail. To this end, we used web probing and coded respondents’ open-ended answers. The results indicate that respondents use both the verbal labels to interpret the scale as well as the position within a scale to map their health status onto the response scale provided. Hence, it cannot be fully concluded that the verbal labels take precedence over the position. Respondents assessing their health as “very good” on the ISSP scale (response option two) also mentioned health aspects with a negative tone compared to respondents who rated their health as “very good” when this was the most positive option on the response scale provided. Although respondents use and interpret the labels semantically, the labels are not independent of the position in the scale. With regard to the aspects respondents considered when assessing their health, we did not find differences across the scale versions. Our qualitative results are largely consistent with previous qualitative studies, as the key dimensions are similar. The physical constitution/dimension was already an important factor in previous studies, and our categories “general” and “specific health problems” were the second and third most frequently mentioned aspects overall. However, psychological factors such as mental health did not play an important role. Also, in contrast to previous studies, health-related behaviors were considered most important in our study, which was not the case in other studies (e.g., Simon et al., 2005).
The main implication of our findings is that respondents may map the same health assessment onto different scale points (resulting in different numerical values) due to the different verbal response scale labels while also considering the position within the scale. In particular, researchers need to be aware that differences in response scales when assessing SRH may introduce a comparative bias to a more positive self-assessment of health in those surveys that use an unbalanced scale. When combining data from different surveys, it should be assured that respondents who have the same health status are represented with the same numerical value in a combined variable (Singh, 2020; Singh & Quandt, 2023). As we usually do not have access to the actual health status of respondents, we cannot easily adjust it to other instruments measuring the same construct. A relatively new methodological approach proposed by Singh (2022) uses observed-score equating for harmonizing latent variables across surveys measured as single-item instruments.
To ensure that two (or more) items that differ in one or more question characteristics are actually measuring the same construct (referred to as validity or “construct match”), qualitative methods, such as cognitive interviewing and web probing, have proven to be a useful tool. In our study, we asked only one open-ended question. Implementing more open-ended probes addressing also more specific aspects could provide additional insights into the response process. Besides the limitation to one single probe, we also acknowledge the German context of the study, which raises the question as to whether our findings are applicable to other contexts. We recognize that respondents’ interpretation of scale labels and constructs might be influenced by the cultural or linguistic contexts; this pertains, for example, to the German translation of “excellent” (“ausgezeichnet”) in the ISSP scale; it corresponds to “excellent” in semantic terms but likely not in pragmatic terms when considering actual language use in the country and in the given context (Börsch-Supan et al., 2005, even suggest an “ironic exaggeration” when “ausgezeichnet” is used in the context of health). Other studies have highlighted challenges of non-equivalence and/or problems of translating “fair” into Spanish and other languages (e.g., Erving & Zajdel, 2022; Lee et al., 2019; Santos-Lozada 2023; Wagner et al., 1998). Against this backdrop, using the SRH item for cross-cultural comparisons makes the issue of scale comparability even more challenging. With regard to external validity of these findings, we encourage further studies on the influence of scale labels on the response behavior for assessing SRH, in further languages and across languages. In cross-cultural contexts, web probing is an effective way to assess comparability (Behr et al., 2020), also in combination with quantitative equivalence assessments (Meitinger, 2017).
Contrary to the assumption that it does not matter whether a balanced or unbalanced scale is used (Lee, 2014), our results indicate a mean bias as well as different interpretations depending on the scale used. Respondents use the position and verbal label as a criterion when mapping their health status on the scale provided. With regard to best practice recommendations as to which scale (labels) to use when measuring SRH on a five-point scale, we must acknowledge that further research is needed. Previous research has shown that respondents often do not choose extreme labels on a scale. This argues against a scale with “excellent” as the most positive response option (at least in some populations and for cross-cultural comparisons). The results are less clear for the three balanced scales. We suggest that further experiments should be conducted to investigate how well the different versions of the SRH scale correlate with specific health measures (e.g., convergent validity) or health-related outcomes (i.e., criterion validity). In addition, asking the same respondents multiple times about their general health using the same instrument would allow for estimating test-retest reliability (Singh & Quandt, 2023). When the distribution of health is expected to skew in one direction, either on the positive or negative side of the scale (e.g. due to a specific target population), using an asymmetrical scale to measure health can be beneficial as it allows for greater discrimination.
Previous research has also found different interpretations of health during childhood and adolescence, with differing understandings of health potentially leading to variations in the interpretation of SRH. More research is needed on the understanding of health and related factors among different age groups (e.g., Kroh et al., 2023), and whether the same scale should be adapted for children and adults.
AAPOR (2010). Research Synthesis: AAPOR Report on online panels. Public Opinion Quarterly, 74(4), 711–781. Prepared for the AAPOR Executive Council by a Task Force operating under the auspices of the AAPOR Standards Committee, with members including: Baker, R./ Blumberg, S./Brick, M.,/ Couper, M. P./Courtright, M./Dennis, M./Dillman, D./Frankel, M./Garland, P./Groves, R. M./Courtney K./Krosnick, J./Lavrakas, P./Lee, S./Link, M./Piekarski, L./Rao, K./Thomas, R./ Zahs, D. →
Au, N., & Johnston, D. W. (2014). Self-assessed health: what does it mean and what does it hide? Social Science & Medicine, 121, 21–28. →
Bailis, D. S., Segall, A., & Chipperfield, J. G. (2003). Two views of self-rated general health status. Social Science & Medicine, 56(2), 203–217. →
Behr, D., Meitinger, K., Braun, M., & Kaczmirek, L. (2017). Web probing—implementing probing techniques from cognitive interviewing in web surveys with the goal to assess the validity of survey questions. GESIS—Survey Guidelines. Mannheim: GESIS—Leibniz-Institute for the Social Sciences. https://doi.org/10.15465/gesis-sg_en_023. a, b, c
Behr, D., Meitinger, K., Braun, M., & Kaczmirek, L. (2020). Cross-national web probing: An overview of its methodology and its use in cross-national studies. In P. C. Beatty, D. Collins, L. Kaye, J.-L. Padilla, G. B. Willis & A. Wilmot (Eds.), Advances in questionnaire design, development, evaluation and testing. Wiley. →
Börsch-Supan, A., Hank, K., & Jürges, H. (2005). A new comprehensive and international view on ageing: introducing the ‘Survey of Health, Ageing and Retirement in Europe. European Journal of Ageing, 2(4), 245–253. →
Callegaro, M., & DiSogra, C. (2008). Computing response metrics for online panels. Public Opinion Quarterly, 72(5), 1008–1032. →
Cullati, S., Bochatay, N., Rossier, C., Guessous, I., Burton-Jeangros, C., & Courvoisier, D. S. (2020). Does the single-item self-rated health measure the same thing across different wordings? Construct validity study. Quality of Life Research, 29, 2593–2604. →
Erving, C. L., & Zajdel, R. (2022). Assessing the validity of self-rated health across ethnic groups: implications for health disparities research. Journal of Racial and Ethnic Health Disparities, , 1–16. →
Federal Statistical Office (2024). Population by territory and average age. https://www.destatis.de/EN/Themes/Society-Environment/Population/Current-Population/Tables/population-by-territory-and-average-age.html →
Fowler, S. L., & Willis, G. B. (2020). The practice of cognitive interviewing through web probing. In P. C. Beatty, D. Collins, L. Kaye, J.-L. Padilla, G. B. Willis A. Wilmot (Eds.), Advances in questionnaire design, development, evaluation and testing (pp. 451–469). Hoboken: John Wiley Sons. →
Garbarski, D. (2016). Research in and prospects for the measurement of health using self-rated health. Public Opinion Quarterly, 80(4), 977–997. a, b, c, d, e, f
Garbarski, D., Schaeffer, N. C., Dykema, J. (2015). The effects of response option order and question order on self-rated health. Quality of Life Research, 24, 1443–1453. a, b
Garbarski, D., Schaeffer, N. C., Dykema, J. (2016). The effect of response option order on self-rated health: a replication study. Quality of Life Research, 25(8), 2117–2121.
Garbarski, D., Dykema, J., Croes, K. D., Edwards, D. F. (2017). How participants report their health status: cognitive interviews of self-rated health across race/ethnicity, gender, age, and educational attainment. BMC Public Health, 17, 771. →
Groves, R. M., Fultz, N. H., Martin, E. (1992). Direct questioning about comprehension in a survey setting. In J. M. Tanur (Ed.), Questions about questions: Inquiries into the cognitive bases of surveys. New York: SAGE. a, b
Idler, E. L., Benyamini, Y. (1997). Self-rated health and mortality: a review of twenty-seven community studies. Journal of health and social behavior, 38(1), 21–37. →
Jürges, H. (2007). True health vs response styles: Exploring cross-country differences in self-reported health. Health economics, 16(2), 163–178. →
Jürges, H., Avendano, M., Mackenbach, J. P. (2008). Are different measures of self-rated health comparable? An assessment in five European countries. European journal of epidemiology, 23, 773–781. →
Kolen, M. J., Brennan, R. L. (2014). Test Equating, scaling, and linking (3rd edn.). New York: Springer. →
Kroh, J., Tuppat, J., Gentile, R., et al. (2023). How do children rate their health? An investigation of considered health dimensions, health factors, and assessment strategies. Child Indicators Research, 16, 2545–2580. https://doi.org/10.1007/s12187-023-10066-6. →
Krosnick, J. (1999). Maximizing questionnaire quality. Measures of political attitudes, 2, 37–58. →
Lee, S. (2014). Self-rated health in health surveys. In T. P. Johnson (Ed.), Handbook of health survey methods. Hoboken: Wiley. a, b
Lee, S., Schwarz, N. (2014). Question context and priming meaning of health: effect on differences in self-rated health between hispanics and non-hispanic whites. American Journal of Public Health, 104, 179–185. →
Lee, S., Alvarado-Leiton, F., Vasquez, E., Davis, R. E. (2019). Impact of the terms “regular” or “pasable” as Spanish translation for “fair” of the self-rated health question among US Latinos: a randomized experiment. American Journal of Public Health, 109(12), 1789–1796. →
Lee, S., McClain, C., Behr, D., Meitinger, K. (2020). Exploring mental models behind self-rated health and subjective life expectancy through web probing. Field Methods, 32(3), 309–326. a, b, c, d
Meitinger, K. (2017). Necessary but insufficient: why measurement invariance tests need online probing as a complementary tool. Public Opinion Quarterly, 81(2), 447–472. https://doi.org/10.1093/poq/nfx009. →
Miller, K., Willson, S., Chepp, V., Padilla, J.-L. (Eds.). (2014). Cognitive interviewing methodology. Hoboken: John Wiley Sons. a, b
Neuert, C., Meitinger, K., Behr, D. (2025). Replication data and code: The influence of response scale labels on the assessment of self-rated health (Version 1.0.0) [Data set]. Köln: GESIS. https://doi.org/10.7802/2924. →
Presser, S., Couper, M. P., Lessler, J. T., Martin, E., Martin, J., Rothgeb, J. M., et al. (2004). Methods for testing and evaluating survey questions. Public Opinion Quarterly, 68, 109–130. →
RKI – Robert Koch-Institut, Abteilung für Epidemiologie und Gesundheitsmonitoring (2018). Gesundheit in Deutschland aktuell 2014/2015-EHIS (GEDA 2014/2015-EHIS). Scientific Use File 1. https://doi.org/10.7797/19-201415-1-1-1. →
Rohrmann, B. (1978). Empirische Studien zur Entwicklung von Antwortskalen für die sozialwissenschaftliche Forschung. Zeitschrift für Sozial-Psychologie, 9(3), 222–245. →
Rohrmann, B. (2007). Verbal qualifiers for rating scales: sociolinguistic considerations and psychometric data. Project Report. University of Melbourne. →
Santos-Lozada, A. R. (2023). Implications of Spanish interviews in health surveys as collected in the United States: the case of Self-Reported Health. Preventive Medicine Reports, 31, 102103. →
Simon, J. G., De Boer, J. B., Joung, I. M. A., Bosma, H., Mackenbach, J. P. (2005). How is your health in general? A qualitative study on self-assessed health. The European Journal of Public Health, 15(2), 200–208. a, b
Singh, R. K. (2020). Ceci n’est pas une pipe: Disentangling measurement and reality in ex-post harmonization. GESIS Blog Series: Adventures in ex-post harmonization. https://doi.org/10.34879/gesisblog.2020.29. →
Singh, R. K. (2022). Harmonizing single-question instruments for latent constructs with equating using political interest as an example. Survey Research Methods, 16(3), 353–369. →
Singh, R. K., Quandt, M. (2023). Assessing and improving the comparability of latent construct measurements in ex-post harmonization. In I. Tomescu-Dubrow, C. Wolf, K. M. Slomczynski J. C. Jenkins (Eds.), Survey data harmonization in the social sciences (pp. 305–322). New York: Wiley. a, b, c
Tourangeau, R., Rips, L. J., Rasinski, K. (2000). The psychology of survey response. Cambridge: University Press. →
Tourangeau, R., Couper, M. P., Conrad, F. (2007). Color, labels, and interpretive heuristics for response scales. Public Opinion Quarterly, 71, 91–112. →
Wagner, A. K., Gandek, B., Aaronson, N. K., Acquadro, C., Alonso, J., Apolone, G., Bullinger, M., Bjorner, J., Fukuhara, S., Kaasa, S., Leplège, A., Sullivan, M., Wood-Dauphinee, S., Ware Jr, J. E. (1998). Cross-cultural comparisons of the content of SF-36 translations across 10 countries: results from the IQOLA project. Journal of clinical epidemiology, 51(11), 925–932. →
Willis, G. B. (2005). Cognitive interviewing: a tool for improving questionnaire design. Thousand Oaks: SAGE. a, b
Willis, G. B. (2015). Analysis of the cognitive interview in questionnaire design. Understanding qualitative research. Oxford: Oxford University Press. →