The online version of this article (https://doi.org/10.18148/srm/2026.v20i2.8453) contains supplementary material.
Surveys are a systematic method for collecting information about people’s opinions, attitudes, and behaviors using questionnaires. Researchers employ questionnaires to assess respondents’ perspectives or positions on theoretical concepts with standardized questions—or, more generally, requests for answers—which are often accompanied by predefined answer scales. Together, these are referred to as survey items or measurement instruments. When faced with a specific request for an answer, respondents embark on a multifaceted process: comprehending and interpreting the question, recalling and evaluating relevant information, and subsequently mapping their opinion, attitude, or behavior onto the provided answer scale (Strack and Martin, 1987; Tourangeau, 1984; Tourangeau et al., 2000). This is a complex, error-prone process. Misunderstanding what is being asked or inadvertently selecting incorrect answer options are potential pitfalls. Moreover, the decisions made by questionnaire developers significantly influence respondents’ answers. The creation of survey items entails numerous considerations, encompassing not only content-related aspects but also formal and linguistic characteristics, such as the properties of the answer scales and the level of abstraction in word choices. Consequently, some scholars say that designing questionnaires is an art, while others claim it is a science (Oberski, 2016).
Good survey questions—that is, survey items that measure the underlying construct of interest in the best way possible—play a pivotal role in enabling researchers to derive meaningful conclusions from the collected data. Measurement error refers to the discrepancy between the true value of the construct and the value obtained through measurement, caused by various factors such as respondent biases, question wording, or data collection procedures. In applied survey research, a perfect relationship between the construct of interest and the measurement instrument is often assumed. However, methodological survey research has shown that this assumption is almost never valid, due to the presence of measurement error (Alwin, 2007; Saris & Gallhofer, 2014).
Acknowledging the existence of measurement error is crucial, as it impacts not only the data quality but also substantive conclusions—sometimes in unexpected ways. For instance, measurement error can distort relationships, rather than merely weakening them, potentially leading to incorrect inferences. Addressing measurement error is therefore essential to ensure data precision and to prevent errors that could obscure or misrepresent important effects, for example, in determining whether a therapy’s success is due to its actual effectiveness rather than to flaws in measurement.
Willem Saris and colleagues made substantial contributions to the study of questionnaire design choices, aiming to establish scientific principles for creating high-quality survey items.1 One widely used approach to estimate the measurement quality of survey questions is the Multitrait-Multimethod (MTMM) design, first suggested by Campbell and Fiske (1959) and further developed by Saris and Andrews (1991). This approach involves measuring several related concepts (referred to as traits or factors) multiple times using different methods (e.g., varying answer scales). A common implementation is the 3 × 3 design, in which three latent variables are measured using three different methods.
A notable contribution by Saris and Andrews (1991) is the development of the True Score MTMM model (TS-MTMM), which builds on and extends the classical notion that observed responses can be decomposed into true scores and error components. While the model’s name echoes the true score model of classical test theory in psychometrics—as seen in the work of Spearman (1904), Novick (1966), and others—it is not identical. In classical test theory, the actual response X obtained from a respondent is assumed to equal a true score T plus some random error E, with the true score reflecting the expected response across repeated measurements of a latent trait.2 Saris and Andrews’ model represents a more complex extension of this idea: instead of assuming a single undifferentiated error term, the TS-MTMM model explicitly separates random error from systematic error (i.e., method effects) and models both within an MTMM framework. This enables the separate estimation of reliability and validity components in survey items.
The TS-MTMM model defines the relationship between respondents’ opinions (treated as continuous latent variables) and their responses, while accounting for measurement error. As in classical test theory, the observed value is assumed to equal the true score plus an error term:
Here, Yij is the observed response for the ith trait (with variance ) and the ith method, Tij is the true score (with variance ), and eij is the random error (with variance ), such that . However, unlike in classical test theory, Saris and Andrews further decompose the true score Tij into the trait Fi (with variance ) and the method effect Mj (with variance ; :
Saris and Andrews introduce two standardized equations. Standardizing Yij and Tij, we obtain the first standardized equation:
where , , and is the reliability coefficient. The squared reliability coefficient (i.e., reliability) reflects the proportion of variance in Yij that is explained by the true score, or in other words,
Random error arises when respondents mistakenly choose incorrect answers, or interviewers accidentally report wrong answers. This type of error disrupts the relationship between the respondent’s actual position on the latent trait (as captured by tij) and the observed response (yij).
The second standardized equation links the standardized true score (tij) to the standardized latent trait () and standardized method ():
Here, is the validity coefficient, and is the method effect coefficient (also called systematic error). The squared validity coefficient the proportion of the variance in the true score Tij that is attributable to the latent trait Fij. In other words, validity is defined as:
The systematic error (or method effect) sj refers to the proportion of the variance of the true score that can be attributed to the method. For instance, it arises when respondents apply stable answering strategies—such as always choosing a more positive answer to leave a good impression or the tendency to avoid extreme responses—that influence their responses similarly across items (Saris et al., 2022).
Combining the two standardized equations (Eqs. 3 and 4) gives the full TS-MTMM model:
where is the quality coefficient, and represents the overall measurement quality of a survey item.
The TS-MTMM model is valuable because it enables separate estimation of reliability and validity. This distinction is important: different item design choices might affect reliability and quality in different ways, and being able to isolate their influence improves the understanding of measurement quality. However, it is essential to note that the terms “reliability” and “validity” in the TS-MTMM model are defined more narrowly than in many psychometric traditions. In particular, the concept validity in this model does not align with broader frameworks that include content validity (how well an item reflects the full conceptual domain), criterion validity (how well an item predicts relevant external outcomes), or construct validity (whether an item truly captures the intended theoretical concept). These broader aspects are not directly assessed (for an overview of validity aspects, see Repke et al., (2024)). Instead, the TS-MTMM model focuses on the structure of the trait and method variance, making its validity estimate most closely related to structural validity, that is, the extent to which observed relationships among items reflect the hypothesized measurement structure.
While the TS-MTMM approach is powerful, it is also resource-intensive: it requires asking each respondent the same questions multiple times using different methods. This increases interview length and can lead to fatigue, careless responding, and memory effects that threaten data quality. The Split-Ballot MTMM (SB-MTMM) design addresses these issues by distributing repeated measures across different respondent subsamples (Saris et al., 2004). This reduces the burden on individuals while statistically compensating for the resulting “missing data by design,” thereby ensuring reliable data collection and improving the overall quality of measurement instruments. Because it is more efficient and practical, the SB-MTMM design has become the preferred approach in large-scale surveys such as the European Social Survey (ESS) and the German GESIS Panel.
However, one limitation remains: MTMM and SB-MTMM designs can only be applied to attitudinal questions. For factual questions—such as a respondent’s gender, age, or number of siblings, the method cannot be meaningfully varied, making MTMM estimation impossible. This restriction is inherent to the MTMM logic, which relies on method variation to estimate measurement quality.
Estimating the quality of survey items using the MTMM procedure poses challenges for researchers. Conducting MTMM experiments for every item in a questionnaire is typically impractical due to substantive costs, increased questionnaire length, time constraints, and potential cognitive burden on respondents. To overcome these limitations, the Survey Quality Predictor (SQP) was developed as a freely available tool (Saris et al., 2000). SQP predicts the quality of survey items based on their formal and linguistic characteristics, drawing on a database of thousands of survey items for which empirical quality estimates from MTMM experiments are available.
This approach builds upon the pioneering findings of Andrews (1984) and the follow-up work by Saris and colleagues (Saris et al., 1998; Scherpenzeel and Saris, 1997), who demonstrated the feasibility of predicting item quality using systematically coded item characteristics or features. These findings laid the foundation for developing a system capable of forecasting the quality of new survey items. By offering an alternative approach (to conducting your own MTMM experiments), SQP addresses the practical constraints associated with estimating survey item quality, thereby enhancing the efficiency of researchers’ endeavors. Unlike traditional research approaches that examine the effects of isolated item features—such as response scale design (see DeCastellarnau (2018) for a review)—SQP simultaneously considers the combined effects of numerous item characteristics. This significantly reduces the need for researchers to extensively review methodological literature to arrive at informed design decisions and thus supports a more efficient and evidence-based questionnaire design.
The initial version of SQP was introduced by Saris et al. (2011) for the computer operating system DOS and then later adapted to Windows as SQP 1.0 (Saris et al., 2004). At that time, predictions were generated using linear regression models based on data from 87 MTMM experiments conducted in English, German, and Dutch. As additional experiments became available, especially through the ESS, the software evolved. In 2011, SQP 2.0 was released (Oberski et al., 2011), incorporating data from ESS Rounds 1 to 3 and replacing linear models with random forests of regression trees to improve prediction accuracy (Oberski et al., 2011). A subsequent version, SQP 2.1, was launched in 2015 with enhanced usability but without changes to the database and the underlying prediction models.
Building upon this foundation, this paper identifies and evaluates the most suitable machine learning algorithm for implementation in a new version of the software—SQP 3.0 (GESIS—Leibniz Institute for the Social Sciences, 2024). This version is based on a significantly expanded dataset that includes over 600 MTMM experiments derived from 56 core experimental designs, spanning up to 28 languages and 32 countries (Asensio Manjon et al., 2026). The experiments cover a broad range of survey topics and methodological design choices—such as varying item formats and response scales, which is essential for training an algorithm intended to generalize across diverse survey settings.
Given the high dimensionality of the item characteristics and the complex dependencies among them, flexible machine learning algorithms are most appropriate to perform the prediction of reliability and validity of items. We test and compare the performance of four different algorithms in predicting reliability and validity and select the model best suited for the needs of SQP. This updated model forms the basis of SQP 3.0 and continues the development path initiated by Saris and Oberski in SQP 1 and refined in subsequent versions.
The dataset comprises 6218 items that have validity and reliability estimates based on the TS-MTMM model calculated by Revilla et al. (2021), who rely on an improved analytical approach developed by Saris and Satorra (2018, 2019).3 The dataset consists of items previously used for quality prediction in SQP 2 (Saris, 2015; Saris et al., 2011; Saris and Satorra, 2018), as well as additional items from MTMM experiments conducted in ESS rounds 4 to 7. The dataset includes only attitudinal survey items, excluding factual items. For each item, between 20 and 60 out of a total of 73 item characteristics are coded. Missing values are rare and recoded into separate categories. The same approach is applied to missings due to filtering. We exclude seven items from the analysis due to missing values in a continuous variable.
To predict question quality, we developed an algorithm that links item characteristics to quality estimates from the MTMM experiments. While SQP 1.0 implemented linear regression as the prediction algorithm (Saris, 2001), random forests were preferred in SQP 2 due to the large number of predictors and dependencies between item characteristics. For these reasons, a flexible model from the field of machine learning is also being sought for SQP 3.
The analysis includes the following characteristics as defined by Saris and Gallhofer (2007) (Table 1) (summary statistics for each of the characteristics can be found in Tables 6 and 7 in the Appendix).
Table 1 Description of all item characteristics.
Variable Name | Description |
Topic-Based Characteristics | |
Domain | The topic that one wants to measure using this survey item. It is determined by the research goal |
Concept | The basic concept that one wants to measure (e.g., evaluation or feeling) |
Social desirability | Items addressing sensitive, delicate, or potentially embarrassing topics that may lead to biased responses |
Centrality | Familiarity of the respondents with the topic |
Reference period | The time period mentioned in the request, which can be present, past, or future |
Formal Characteristics—Introduction | |
Introduction available? | A request for an answer (e.g., the question) might be preceded by an introduction to the topic |
Request present in the introduction | In the introduction, an interrogative form may be used |
Formal Characteristics—Request for an Answer | |
Formulation of the request for an answer: basic choice | A request can be formulated directly or indirectly or not be present (e.g., the item belongs to an item battery and is not the first item) |
WH-word used in the request | Requests may start with words like who, which, what, when, where, how, to what extent, to what/which degree, or whether (or their corresponding translations in other languages) |
Request for an answer type | Requests may be formulated in an interrogative, imperative, or declarative form |
Theoretical range of the concept bipolar/unipolar | Identifies whether the concept measured in the request is theoretically bipolar or unipolar, regardless of which formulation is used in the question |
Use of gradation | Identifies requests that indicate responses that can be ordered from low to high or from high to low |
Balance of the request | Identifies leading survey items. A request is balanced when it contains both possible answer poles and unbalanced when just one pole is mentioned |
Presence of encouragement to answer | Requests may provide encouragement for the respondent to answer, such as: “Please, tell me …,” “We would like to ask you …,” etc |
Respondent instruction | Sometimes respondents receive instructions (usually in an imperative or polite form) |
Emphasis on subjective opinion in request | Requests may emphasize the opinion of the respondent, such as: “Please give us your opinion about …,” “According to you …,” “What do you think about …,” etc. |
Information about the opinions of other people | Requests may include information on other people’s opinions, such as:” Some people are against nuclear energy while others are in favor of it.” |
Extra information or definition | Sometimes extra information or definitions are provided. It is considered extra because the question could also be asked without it |
Knowledge provided | Determines what type of information is provided: definitions, other explanations, or both |
Use of stimulus or treatment in the request | Survey items may be part of item batteries. A stimulus in a survey item can be a noun or a combination of words. A statement in a survey item consists of complete sentences |
Absolute or comparative judgment | Identifies whether respondents have to make an absolute or comparative judgment |
Formal Characteristics—Answer Options | |
Response scale: basic choice | A request is usually followed by a response scale. These could be two-category scales, more than two-category scales, numerical open-ended scales, magnitude estimation, line production, and more step procedures |
Number of categories | Is the number of answer options on the response scale |
Labels of categories | The answer categories might be fully labeled, partially labeled, or not labeled |
Labels with short text or complete sentences | Verbal labels can be formulated as short text or complete sentences |
Order of the labels | Verbal labels can be ordered from positive (or active/high) to negative (or passive/low) or vice versa |
Correspondence between labels and numbers of the scale | Numeric values can mirror the verbal labels in the answer options in terms of direction and intensity |
Range of the used scale bipolar/unipolar | Indicates whether the answer scale used is bipolar or unipolar, regardless of the formulation in the request |
Symmetry of response scale | Bipolar scales can be symmetric or asymmetric |
Neutral category | Answer scales may have a neutral category that is either placed in the middle of the scale or explicitly mentioned |
Number of fixed reference points | This refers to the number of verbal labels in the answer scale that are unmistakably understood in the same way by all respondents |
Don’t know option | Response scales may have an explicitly mentioned “don’t know” option or not have this option at all. Sometimes, the “don’t know” option is not explicitly communicated but registered when the respondent does not know the answer |
Consistency between theoretical range and used range scale | The theoretical range of a concept in terms of polarity may or may not correspond to the range used in the answer scale |
Linguistic Characteristics—Introduction | |
Number of sentences | The total number of sentences that the introduction consists of |
Number of words | The total number of words the introduction consists of |
Number of subordinate clauses | The total number of subordinate clauses (i.e., de pendent clauses) the introduction consists of |
Linguistic Characteristics—Request for an Answer | |
Number of sentences | The total number of sentences that the request consists of |
Number of words | The total number of words the request consists of |
Number of nouns | The total number of nouns the request consists of |
Number of abstract nouns | The total number of abstract nouns the request consists of |
Number of syllables | The total number of syllables of all the words the request consists of |
Number of subordinate clauses | The total number of subordinate clauses (i.e., dependent clauses) the request consists of |
Linguistic Characteristics—Answer Options | |
Number of syllables | The total number of syllables of all the words the answer options consist of |
Number of nouns | The total number of nouns the answer options consist of |
Number of abstract nouns | The total number of abstract nouns the answer scale consists of |
Layout Characteristics | |
Showcard or other visual aids used | In face-to-face surveys, showcards are often used to show the answer categories or explain the question to the respondent. In web surveys, the screen is considered a visual aid |
Horizontal or vertical scale | The answer scale options can be displayed horizontally or vertically in the visual aid |
Overlap of scale labels and categories | An overlap occurs when the scale label of one category overlaps with another category in the visual aid |
Numbers or letters before the answer categories | Numbers or letters usually order the answer categories next to the verbal labels |
Scale with only numbers or numbers in boxes | Sometimes the numbers before the categories are in boxes to provide a clear separation between the options |
Start of the response sentence on the visual aid | Visual aids may provide the start of the response sentence |
Request on the visual aid | Visual aids may provide the whole request for an answer before the answer categories |
Picture provided? | Surveys may include pictures to provide additional information for the respondent |
Data Collection Characteristics | |
Computer-assisted | Respondents’ answers can be collected with a computer or manually on a paper questionnaire |
Interviewer | Survey questions can be read out by an interviewer or completed by the respondent |
Interviewer instruction | Survey questions may include instructions for the interviewer if present |
Visual or oral presentation | A survey question may be presented visually or orally to the respondent |
Language | The language in which the survey item is formulated |
To learn a model that best predicts the quality of survey questions, we applied and compared four machine learning methods. We created separate models to predict (a) the reliability coefficient and (b) the validity coefficient, including the 55 characteristics described in Section 2.1. Categorical features were converted into dummy variables, resulting in final models that included 173 variables.
To identify the best prediction algorithm, we tested four learners against each other. Our data set contains many correlated variables (e.g., the number of fixed reference points cannot exceed the number of categories), and the filtering produces systematic missingness (e.g., all variables concerning the characteristics of the showcards are missing if showcards were not used). Since standard linear regression performs poorly with collinear variables, we chose two penalized regression models that allow for model selection, avoiding the inclusion of too many variables. Applying some penalization to linear regression models is beneficial in scenarios with a large set of potential predictor variables, not all of which may be relevant. Using penalized regression enhances the predictive power of the model and reduces prediction error.
Our evaluation further included two tree-based machine learning algorithms (i.e., random forests and boosted trees) that can flexibly model non-linear terms and interactions. We assessed the quality of the learners by computing the prediction error on untouched test data. Specifically, we used nested cross-validation to simultaneously tune the hyperparameters of the respective learners and obtain an unbiased estimate of the generalization error, which can be considered as state-of-the-art technique for this task (Bischl et al., 2023). The entire analysis was performed in R (R Core Team, 2023) using the mlr3 framework (Lang et al., 2019) with the add-on package mlr3summary (Dandl et al., 2024) for model summaries.
We considered two penalized regressions that allow for model selection: the Least Absolute Shrinkage and Selection Operator (LASSO; see Tibshirani, 1996) and Elastic Net (Zou and Hastie, 2005). Penalized regression augments the empirical risk of linear regression with a penalty term that counteracts overfitting and shrinks the parameter estimates. The regularized empirical risk for obtaining the LASSO estimator is given by
where yi and xi denote the target or dependent variable (here, validity or reliability) and feature vectors of item i, respectively, β is the vector of regression coefficients, and is the penalty term. The estimator βˆ is found by minimizing the risk, that is,
As can be seen, the LASSO penalizes the sum of the absolute values of the parameter estimates, effectively shrinking model parameter estimates to zero and eliminating the corresponding variables from the model. The LASSO tends to give one of the correlated predictors a large coefficient and give the others very small coefficients or completely remove them from the model. The parameter λ controls the strength of the penalty, with λ = 0 resulting in unpenalized standard linear regression. A cross-validation procedure is used to find the optimal λ that minimizes the mean squared error (MSE) of the model.
Similarly, Elastic Net adds a penalty term for squared parameter estimates, known from Ridge regression (Hoerl and Kennard, 1970).
Elastic Net corresponds to LASSO when α = 1 and to Ridge regression when α = 0. Ridge regression shrinks parameter estimates toward zero, but since parameter estimates can never be exactly zero, it does not perform variable selection. Elastic Net serves as a compromise between Ridge regression and LASSO, with α controlling the weight of each penalty. Any α between zero and one leads to a model that is less selective than the LASSO. In our analysis, the hyperparameters tuned were (a) the elastic-net weight α and (b) the penalty weight λ.
Our analysis included two machine learning algorithms that are ensembles of classification and regression trees (CARTs): random forest and boosted trees. Random forests are an ensemble of CARTs trained in parallel and subsequently aggregated to receive the final prediction (Breiman, 2001). The first random component involves training parallel trees on different bootstrap samples of the training data; the second random component is that, in each split, only a random subset of features is considered for finding the best split. Random forests comprise several hyperparameters that need to be set before model training, with the best hyperparameters identified during tuning. In our analysis, the tuned hyperparameters were (a) the number of trees trained in parallel (num.trees), (b) the number of features considered for splitting in each node (mtry), and (c) the maximal depth of each tree (max.depth).
In contrast, extreme gradient boosting (Chen and Guestrin, 2016) builds trees sequentially, with each new tree improving the performance of the current ensemble. As in random forests, predictions of single trees are aggregated to obtain the final prediction. The hyperparameters tuned in our analysis are (a) the number of trees (num.trees), (b) the learning rate (eta), and (c) the maximal depth of each tree (max.depth).
All learners were tuned using grid search and 5‑fold cross-validation (CV). For estimating generalization errors, we used nested resampling with an inner 5‑fold CV and an outer 3‑fold CV. The performance of the individual learners was evaluated and compared using the mean squared error (MSE). Table 2 summarizes the hyperparameters and tuning search spaces. Both quality indicators can only take values between zero and one. Predicted values that are outside this range are thus set to zero or one.
Table 2 Hyperparameter ranges tuned via grid search.
Prediction Algorithm | Hyperparameter | Scale | Min | Max |
Values for λ are not part of the grid and instead found via the R function cv.glmnet (https://www.quantargo.com/help/r/latest/packages/glmnet/4.1-1/cv.glmnet) | ||||
LASSO | λ | Numeric | N/A | N/A |
Elastic Net | α | Numeric | 0 | 1 |
λ | Numeric | N/A | N/A | |
Random forest | Num.trees | Integer | 200 | 1000 |
Mtry | Integer | 4 | 16 | |
Max.depth | Integer | 1 | 50 | |
Extreme gradient boosting | Num.trees | Integer | 1 | 200 |
Eta | Numeric | 0.1 | 0.7 | |
Max.depth | Integer | 1 | 16 | |
Table 3 presents the mean squared error (MSE) for the four models under study. The penalized regression models are clearly outperformed by both random forest and extreme gradient boosting. These tree-based models perform similarly well, with random forest slightly performing better for reliability and extreme boosting performing better for validity. Both models are well-suited for the prediction task.
Table 3 Performance of the algorithms used to predict validity and reliability.
Quality Indicator | Prediction Algorithm | MSE |
Reliability | LASSO | 0.00621 |
Elastic Net | 0.00608 | |
Random forest | 0.00461 | |
Extreme gradient boosting | 0.00479 | |
Validity | LASSO | 0.00637 |
Elastic Net | 0.00635 | |
Random forest | 0.00459 | |
Extreme gradient boosting | 0.00455 |
For the implementation in SQP 3.0, we aim not only to use an effective prediction algorithm but also to provide estimates with standard errors and prediction intervals. While estimating and implementing prediction intervals for random forest is possible, no readily available prediction intervals exist for extreme gradient boosting. Given the similar performance of both algorithms, we decided to implement random forest in SQP 3.0 for both reliability and validity.
Prediction intervals for the final random forest models are based on the distribution of predicted reliability and validity estimates from the individual trees of the random forests. These intervals represent the interquartile range of these distributions, with the lower limit given by the 25%-quantile and the upper limit by the 75%-quantile.
To obtain the final models for reliability and validity, random forests were tuned using 5‑fold CV for hyperparameter optimization. Table 4 shows the optimal hyperparameter configurations for the random forests for both item quality indicators.
Table 4 Optimal hyperparameter configuration and predictive performance of the random forest models implemented in SQP 3.0.
Quality indicator | Max.depth | Mtry | Num.trees | MSE |
Reliability | 17 | 16 | 1000 | 0.00460 |
Validity | 50 | 16 | 680 | 0.00443 |
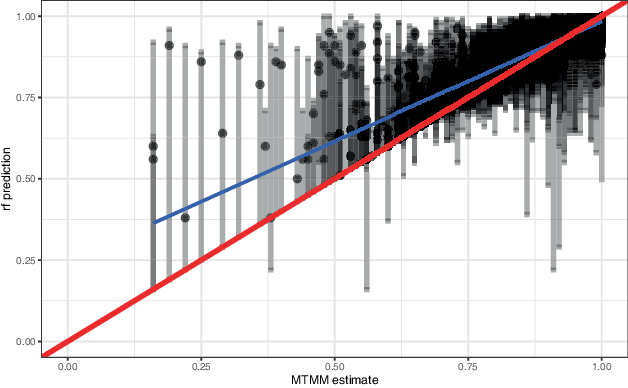
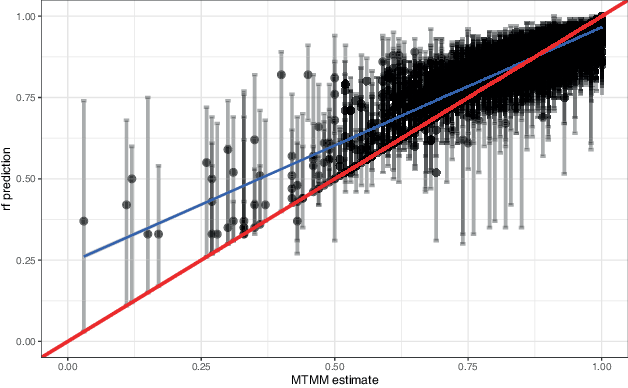
The final random forests are trained on the whole data set using these best hyperparameters. Both models fit the data very well, with R2 = 0.82 for reliability and R2 = 0.84 for validity. Figs. 1 and 2 display plots of the random forest predictions for reliability and validity against their MTMM estimates. The red line indicates a perfect fit, where predicted values exactly match the true ones. The blue line denotes the least squares estimation of the relationship between the true and predicted quality indicators. For a perfect model, the blue and red lines would entirely overlap. The greater the deviation between the blue and red lines, the more bias is observed in the prediction model. Prediction intervals for each estimate are included in the figures. The coverage rates of the prediction intervals are very high for reliability and validity with 94% of the prediction intervals covering the MTMM estimate for reliability and 99% for validity.
For both reliability and validity, several very low MTMM estimates are severely overestimated by the random forest model while some very high estimates are underestimated. The overestimation of low MTMM estimates, however, affects significantly more items and causes greater deviations than the underestimation of high MTMM values. Overall, the random forest models perform very well for most of the data but struggle to accurately predict some strong outliers.
To understand the specific contributions of the item characteristics to the items’ reliability and validity, we evaluated the permutation feature importance. The intuition behind feature importance is that the model’s fit worsens when an important variable is excluded. Instead of excluding a feature, permutation feature importance permutes the feature’s values, effectively destroying its relationship with the dependent variable.
The increase in the prediction error of the model after feature permutation measures the feature’s importance (for a comparison of different feature importance methods and their interpretations, see Ewald et al., 2024). Fig. 3 shows the permutation importance of the 15 most important item characteristics for reliability and validity. The importance of all items in the model can be found in Table 5 and Fig. 4 in the Appendix.
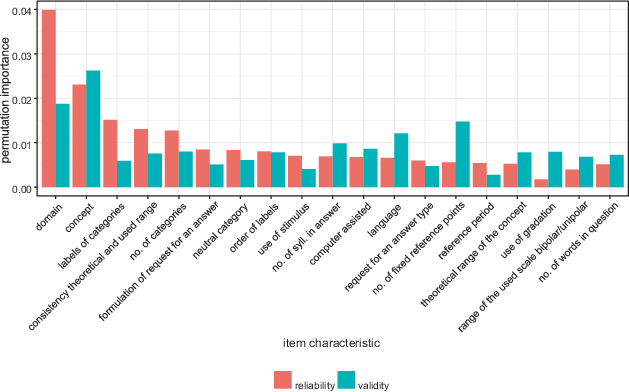
In general, there is an overlap between the 15 most important item characteristics for reliability and validity: domain, concept, number of categories, order of labels, formulation of request for an answer, number of fixed reference points, consistency of the theoretical and used range, number of syllables in the answer, being computer-assisted, and language are among the 15 most important item characteristics for both quality indicators.
However, the reference period, request for an answer type, use of a stimulus, labels of categories, presence of a neutral category, and the formulation of the request for an answer are among the 15 most important characteristics for reliability only (ranked 42, 26, 29, 17, 16, and 24 for validity), whereas centrality, the theoretical range of the concept, the use of gradation, the range of the used scale, the number of words in the request for an answer and the number of syllabus in the request for an answer are among the most important characteristics for validity only (ranked 17, 16, 39, 22, 18, and 19 for reliability).
We find the topic-based characteristics domain and concept to be the two most important item characteristics for both reliability and validity. Notably, none of the layout characteristics are among the 15 most important item characteristics, and all formal and linguistic characteristics of the introduction are among the least important characteristics.
The study aimed to identify the best algorithm for predicting item reliability and validity based on formal and linguistic item characteristics. Using a comprehensive dataset of attitudinal survey items and associated quality estimates derived from MTMM experiments, we demonstrated that quality parameters of the TS-MTMM model can be effectively predicted from coded item characteristics. This supports the original proposition by Saris et al. (1998) and Saris and Gallhofer (2014) and underpins the methodology implemented in SQP. Further, permutation feature importance revealed that a largely overlapping set of item characteristics shapes both reliability and validity, indicating that improvements in one dimension do not necessarily compromise the other. This supports the practical utility of SQP for optimizing item design across multiple quality dimensions simultaneously. Consistent results were reported by Oberski et al. (2011) in analyses of conditional variable importance in SQP 2.0.
Overall, the model fit was convincing (MSE and R2). However, the random forest algorithm struggled to predict extreme outliers with very low or very high empirical MTMM estimates. Improving predictive accuracy for such items represents an important avenue for future research, for instance, by expanding the SQP coding scheme to include additional syntactic features (e.g., clausal vs. appositive constructions, use of active vs. passive language), readability metrics (e.g., word and sentence difficulty), or domain-specific characteristics (e.g., technical vs. everyday vocabulary).
The dataset is unique in that the dependent variables—item reliability and validity—are estimates derived from MTMM experiments rather than directly observed values. Consequently, four assumptions underlie the model: (1) reliability and validity are meaningful concepts for subjective variables such as attitudes and opinions; (2) MTMM experiments are suitable for generating these estimates; (3) memory effects between repeated measurements are negligible, although Tourangeau (2021) notes this may not always hold; and (4) the structural equation modeling approach used to estimate the TS-MTMM parameters is appropriate.
Several limitations of the study should be acknowledged. First, the prediction model relies on point estimates of reliability and validity without accounting for their variance, which is implicitly assumed to be zero. Second, only a subset of item characteristics included in the model was experimentally manipulated; others were observed but not randomly allocated. Third, no causal interpretation of the relationship between item characteristics and predicted quality can be made, nor can conclusions be drawn about how manipulations of characteristics would affect predictions. Fourth, most experiments feeding into the algorithm were conducted in the ESS context and cover topics such as social trust, political efficacy, and life satisfaction. Although the items contain a wide spread of topics and design choices, it is unclear whether the algorithm generalizes to items addressing other topics or incorporating design choices not covered in the ESS. Finally, SQP’s quality predictions are derived solely from formal and linguistic item characteristics (Yan et al., 2012), without semantic understanding. This means, in particular, that SQP is not suitable for assessing whether the item measures the correct construct.
Despite these limitations, SQP remains a useful tool for survey researchers because it provides insights at the item level that are otherwise difficult to obtain. In particular, it offers four key benefits to the survey research community. First, it serves as a comprehensive database of attitudinal survey items with coded item characteristics and measurement quality predictions. Researchers can consult this database to identify high-quality items for reuse in future surveys. Second, SQP supports the design of new survey items by providing quality predictions—along with associated prediction intervals and standard errors—based on user-coded item characteristics. This enables researchers to compare alternative item formulations and make evidence-based design decisions. Third, SQP can serve as a translation check tool, particularly valuable in multinational, multiregional, and multicultural contexts. By comparing coded item characteristics across language versions, researchers can detect inconsistencies or potential translation issues. Fourth, the predicted measurement quality could potentially be used to correct the effects of measurement errors on the analysis of items capturing subjective constructs, thereby improving the validity of substantive conclusions (Saris and Revilla, 2016).
It is important to note that SQP’s definitions of reliability and validity follow the TS-MTMM model and thus differ from broader definitions in psychometrics. In particular, psychometric validity is understood as a multifaceted concept that includes, among others, content validity, criterion validity, construct validity, and structural validity (Price, 2016; Rammstedt et al., 2014)—each addressing different aspects of the extent to which a measure captures the intended concept. SQP, by contrast, focuses on distinguishing random from systematic measurement error. It infers validity from formal and linguistic item characteristics without semantic understanding, making its validity predictions most closely related to structural validity. Broader aspects, such as content or criterion validity, are not addressed. This distinction matters because content validity and structural validity can sometimes stand in tension: a highly content-valid measurement instrument may sacrifice structural validity but still enhance overall construct validity (Rammstedt et al., 2021).
As such, SQP 3.0 with its new random forest algorithm (available at sqp.gesis.org), addresses an important gap in survey research. Whereas traditional psychometric approaches to structural validity generally require multi-item scales—leaving the structural quality of single-item instruments largely hidden—SQP provides a practical, data-driven means to assess the measurement quality of single-item survey questions. By offering empirical-based insights at the item level, SQP complements existing validation strategies and can be integrated with other forms of psychometric evaluation to strengthen overall measurement validity. In this way, SQP does not serve as a replacement for broader validation practices but as a valuable tool to guide item design, identify potential weaknesses, and enhance the quality of survey instruments.
Alwin, D. F. (2007). Margins of error: A study of reliability in survey measurement. Wiley. →
Andrews, F. M. (1984). Construct validity and error components of survey mea sures: a structural modeling approach. Public opinion quarterly, 48(2), 409–442. →
Asensio Manjon, M., De Castellarnau, A., Felderer, B., Poses, C., Repke, L., Revilla, M., Saris, W. E., Schwarz, H., & Weber, W. (2026). SQP 3.0 data (Version 1.0.0) [Data set]. Köln: GESIS. https://doi.org/10.7802/2968. →
Bischl, B., Binder, M., Lang, M., Pielok, T., Richter, J., Coors, S., Thomas, J., Ullmann, T., Becker, M., Boulesteix, A.-L., Deng, D., & Lindauer, M. (2023). Hy perparameter optimization: Foundations, algorithms, best practices, and open challenges. WIREs Data Mining and Knowledge Discovery, 13(2), e1484. →
Breiman, L. (2001). Random forests. Machine Learning, 45(1), 5–32. →
Campbell, D. T., & Fiske, D. W. (1959). Convergent and discriminant validation by the multitrait-multimethod matrix. Psychological Bulletin, 56(2), 81–105. →
Chen, T., & Guestrin, C. (2016). Xgboost: a scalable tree boosting system. In Proceedings of the 22nd ACM SIGKDD International Conference on Knowl edge Discovery and Data Mining. KDD ’16. (pp. 785–794). New York: Association for Computing Machinery. →
Dandl S, Becker M, Bischl B, Casalicchio G, Bothmann L (2024). mlr3summary: Concise and interpretable summaries for machine learning models. In Late-breaking Work, Demos and Doctoral Consortium, Joint Proceedings of the 2nd World Conference on eXplainable Artificial Intelligence (xAI 2024), volume 3793 series CEUR Workshop Proceedings. https://ceur-ws.org/Vol-3793/paper_36.pdf. →
DeCastellarnau, A. (2018). A classification of response scale characteristics that affect data quality: a literature review. Quality & quantity, 52(4), 1523–1559. →
Ewald, F. K., Bothmann, L., Wright, M. N., Bischl, B., Casalicchio, G., & König, G. (2024). A guide to feature importance methods for scientific inference. In L. Longo, S. Lapuschkin, & C. Seifert (Eds.), Explainable Artificial Intelligence. xAI 2024 (Vol. 2154, pp. 440–464). Springer. https://doi.org/10.1007/978-3-031-63797-1_22 →
GESIS—Leibniz Institute for the Social Sciences (2024). Survey Quality Predictor 3. [online software] →
Hoerl, A. E., & Kennard, R. W. (1970). Ridge regression: biased estimation for nonorthogonal problems. Technometrics, 12(1), 55–67. →
Lang, M., Binder, M., Richter, J., Schratz, P., Pfisterer, F., Coors, S., Au, Q., Casalicchio, G., Kotthoff, L., & Bischl, B. (2019). mlr3: A modern object-oriented ma chine learning framework in R. Journal of Open Source Software 4(44), 1903, https://doi.org/10.21105/joss.01903. →
Novick, M. R. (1966). The axioms and principal results of classical test theory. Journal of mathematical psychology, 3(1), 1–18. →
Oberski, D. (2016). Questionnaire science. In L. R. Atkeson & R. M. Alvarez (Eds.), The oxford handbook of polling and survey methods. Oxford University Press. →
Oberski, D., Grüner, T., & Saris, W. E. (2011). The prediction of the quality of the questions. In W. E. Saris, D. Oberski, M. Revilla, D. Zavala, L. Lilleoja, I. Gallhofer & T. Grüner (Eds.), The development of the program SQP 2.0 for the prediction of the quality of survey questions. RECSM Working Paper Number 24. (pp. 71–87). a, b, c
Price, L. R. (2016). Psychometric methods: theory into practice. Publications. →
R Core Team (2023). R: a language and environment for statistical computing. Vienna: R Foundation for Statistical Computing. →
Rammstedt, B., Beierlein, C., Brähler, E., Eid, M., Hartig, J., Kersting, M., Liebig, S., Lukas, J., Mayer, A.-K., Menold, N., et al. (2014). Qualitätsstandards zur Entwicklung, Anwendung und Bewertung von Messinstrumenten in der sozialwissenschaftlichen Umfrageforschung. Journal of Contextual Economics–Schmollers Jahrbuch, (4), 517–546. →
Rammstedt, B., Lechner, C. M., & Danner, D. (2021). Short forms do not fall short: a comparison of three (extra-) short forms of the big five. European Journal of Psychological Assessment, 37(1), 23–32. →
Repke, L., Birkenmaier, L., & Lechner, C. (2024). Validity in survey research from research design to measurement instruments. GESIS—Survey Guidelines. Mannheim: GESIS—Leibniz Institute for the Social Sciences. →
Revilla, M., Poses, C., Serra, O., Asensio, M., Schwarz, H., & Weber, W. (2021). Ap plying the estimation using pooled data approach to the multitrait-multimethod experiments of the european social survey (rounds 1 to 7). Structural Equation Modeling: A Multidisciplinary Journal, 28(3), 463–474. a, b
Saris, W. E. (2001). SQP: Survey Quality Predictor. DOS application program →
Saris, W. E. (2015). Survey quality predictor 2 [online software] version 2.1. Barcelona: Universitat Pompeu Fabra. http://sqp.upf.edu →
Saris, W. E., & Andrews, F. M. (1991). Evaluation of measurement instruments using a structural modeling approach. In P. P. Biemer, R. M. Groves, L. E. L. berg, N. A. Mathiowetz & S. Sudman (Eds.), Measurement errors in surveys (pp. 575–597). Wiley. a, b
Saris, W. E., & Gallhofer, I. (2007). Estimation of the effects of measurement characteristics on the quality of survey questions. Survey Research Methods, 1(1), 29–43. →
Saris, W. E., & Gallhofer, I. N. (2014). Design, evaluation, and analysis of questionnaires for survey research (2nd edn.). Wiley. a, b
Saris, W. E., & Revilla, M. (2016). Correction for measurement errors in survey research: necessary and possible. Social Indicators Research, 127(3), 1005–1020. →
Saris, W. E., & Satorra, A. (2018). The pooled data approach for the estimation of split-ballot multitrait–multimethod experiments. Structural Equation Modeling: A Multidisciplinary Journal, 25(5), 659–672. a, b
Saris, W. E., & Satorra, A. (2019). Comparing bsem and eupd estimates for two group sb-mtmmexperiments. Structural Equation Modeling: A Multidisciplinary Journal, 26(5), 745–749. →
Saris, W. E., van Wijk, T., & Scherpenzeel, A. (1998). Validity and reliability of subjective social indicators: the effect of different measures of association. Social Indicators Research, 45(3), 173–199. a, b
Saris, W. E., van der Veld, W., & Gallhofer, I. (2000at). A program for prediction of the quality of survey measurement. In Paper to be presented in October 2000 at the methodology conference. Köln. →
Saris, W. E., Oberski, D., & Kuiper, S. (2004). SQP: survey quality predictor. DOS application program a, b
Saris, W. E., Oberski, D. L., Revilla, M., Zavala-Rojas, D., Lilleoja, L., Gallhofer, I., & Gruner, T. (2011). The development of the program sqp 2.0 for the prediction of the quality of survey questions. Working paper number 24 of the series of the Research and Expertise Centre for Survey Methodology (RECSM). a, b
Saris, W. E., Oberski, D., & Weber, W. (2022). The quality of survey questions for continuous latent variables: your guide to the SQP database and predictions (1st edn.). Independently. →
Scherpenzeel, A. C., & Saris, W. E. (1997). The validity and reliability of survey questions. Sociological Methods & Research, 25(3), 341–383. →
Spearman, C. (1904). The proof and measurement of association between two things. The American journal of psychology, 15, 72–101. →
Strack, F., & Martin, L. L. (1987). Thinking, judging, and communicating: a process account of context effects in attitude surveys. In H.-J. Hippler, N. Schwarz & S. Sudman (Eds.), Social information processing and survey methodology. Recent research in psychology (pp. 123–148). Springer. →
Tibshirani, R. (1996). Regression shrinkage and selection via the lasso. Journal of the Royal Statistical Society Series B: Statistical Methodology, 58(1), 267–288. →
Tourangeau, R. (1984). Cognitive sciences and survey methods. In T. B. Jabine, M. L. Strag, J. M. Tanur & R. Tourangeau (Eds.), Cognitive aspects of survey methodology: building a bridge between disciplines (pp. 73–100). Washington, DC: National Academy Press. →
Tourangeau, R. (2021). Survey reliability: models, methods, and findings. Journal of survey statistics and methodology, 9(5), 961–991. →
Tourangeau, R., Rips, J. L., & Kenneth, R. (2000). The psychology of survey response. Cambridge: Cambridge University Press. →
Yan, T., Kreuter, F., & Tourangeau, R. (2012). Evaluating survey questions: a comparison of methods. Journal of Official Statistics, 28(4), 503. →
Zou, H., & Hastie, T. (2005). Regularization and variable selection via the elastic net. Journal of the Royal Statistical Society Series B: Statistical Methodology, 67(2), 301–320. →