Invitation Messages for Business Surveys. A Multi-Armed Bandit Experiment
835510.18148/srm/2025.v19i3.8355Invitation Messages for Business Surveys. A Multi-Armed Bandit Experiment
Johannes J.
Gaul johannes.gaul@uni-mannheim.de
Florian
Keusch f.keusch@uni-mannheim.de
Davud
Rostam-Afschar rostam-afschar@uni-mannheim.de
Thomas
Simon thomas.simon@uni-mannheim.de
University of MannheimMannheimGermanyLeibniz Centre for European Economic Research (ZEW)MannheimGermanyNetwork for Empirical Tax Research (NeSt)MannheimGermanyInstitute of Labor Economics (IZA)MannheimGermanyGlobal Labor Organization (GLO)MannheimGermany
409212025European Survey Research Association
We investigate the design of a survey invitation message targeted at businesses. By varying five key elements of the survey invitation, we implement a full-factorial experiment with adaptive randomization instead of static group composition. Specifically, as the experiment progresses we apply a Bayesian learning algorithm that assigns more observations to invitation messages with higher starting rates. Our results indicate that personalizing the message, emphasizing the authority of the sender, and pleading for help increase survey starting rates, while stressing strict privacy policies and changing the location of the survey URL have no response-enhancing effect. Our implementation of adaptive randomization is useful for other applications of survey design and methodology.
1 Introduction
Voluntary business surveys, like household surveys, often suffer from low participation. Even worse, recent studies indicate a downward trend in response rates for business surveys (König et al. 2021, Küfner et al. 2022, Pielsticker and Hiebl 2020). This decline must be considered in light of the growing reliance on web-based surveys. For researchers, web surveys offer significant advantages—such as speed, flexibility, scalability, and cost-efficiency—but they are also particularly prone to lower response rates compared to other survey modes (Manfreda et al. 2008). Despite the opportunities associated with web surveys in business contexts, such as an increasing digitization of enterprises and higher web literacy among respondents, the limitations of web surveys remain notable (Daikeler et al. 2020). These limitations include the impersonal nature of online survey requests (Evans and Mathur 2005), privacy concerns (Sax et al. 2003), organizational gatekeepers restricting access to decision-makers (Snijkers et al. 2013), and the complex, time-consuming response process (Haraldsen 2018), which often results in a lack of capacity, motivation, or authorization to engage with the survey request (Langeland et al. 2023, Tomaskovic-Devey et al. 1994).
Low survey participation can be problematic as it may be linked to non-response bias (König and Sakshaug 2023). Yet, efforts to counteract low response rates, such as increasing sample sizes, can significantly drive up costs and may also introduce bias. Researchers are therefore encouraged to use cost-effective measures to increase response rates while maintaining data quality. Naturally, much of the focus has been on optimizing the content and layout of the questionnaires themselves. At the same time, effective communication with potential respondents remains crucial. In many establishment surveys, the self-administered nature of communication relies on one-way outreach, which, although efficient in reaching large numbers of respondents, may lack persuasive power and may fail to engage the intended recipient (Snijkers et al. 2013). In this context, the design and layout of the survey invitation messages are particularly important. If the invitation fails to spark the recipient’s interest in responding, the best questionnaire design will be of no use.
Consequently, a large body of literature has tested the impact of several characteristics of invitation messages on participation behavior in self-administered surveys (e.g., Heerwegh and Loosveldt 2002, Kaplowitz et al. 2012, Trespalacios and Perkins 2016). However, these studies primarily focus on household surveys, and their findings may not extend to the context of businesses due to their specific dynamics and unique constraints (Langeland et al. 2023). First, the flow of information within organizations is more complex than in households (Bavdaž 2010a). There may be multiple potential respondents within a single organization, making it necessary to identify the most appropriate individual to complete the survey (Willimack and Nichols 2010). In addition, releasing data often requires proper authorization, which may involve coordination across different departments or hierarchical levels. Second, the cost-benefit analysis for businesses differs from that of individuals. While the benefits of participation tend to be less obvious, the costs are immediate and include the time and resources devoted to the survey as well as the opportunity cost of diverting attention from core business activities. Third, the response process itself can be intricate, sometimes requiring calculations or retrieving information that is not readily accessible, and may necessitate collaboration among multiple people to gather the necessary data (Bavdaž 2010b).
The peculiarities of the business context, which make insights from household surveys not automatically transferable, must be addressed already in the initial communication with potential respondents to enhance the likelihood of obtaining high-quality responses (Snijkers et al. 2013). Yet, determining the most effective way to phrase and design an invitation message for businesses remains an open empirical question, especially in light of the lack of any unifying theory of survey participation (Dillman 2021, Keusch 2015). Although various theoretical perspectives, such as social exchange theory, cognitive dissonance theory, and leverage-salience theory, suggest that certain elements of an invitation message may enhance participation, their relevance has been inconsistently assessed by survey methodologists (Keusch 2015). Furthermore, traditional survey invitation message experiments test only a small set of alternatives, limiting conclusions about interaction effects and alternative design choices. This constraint arises because it is often prohibitively costly for experimental approaches—given fixed terms and limited budgets—to find the best message design choice from a comprehensive set of alternatives.
This study addresses these gaps by investigating how to design a survey invitation message that specifically targets business decision-makers and by offering an approach to mitigate key challenges in survey production. To this end, we conduct a sequential experiment that varies the content and layout of email invitations issued by the German Business Panel (GBP).1 The GBP systematically surveys a probability sample of all legal entities operating in Germany. Over the course of our 15-week experimental phase, 176,000 firms opened their GBP survey invitation email, enabling a large-scale experimental setup. Our research design varies five key elements of the survey invitation message: (1) personalization, (2) emphasis on the authority of the sender, (3) survey link placement, (4) compliance with data protection, and (5) distinct request styles, either offering potential survey respondents the opportunity to share their opinion or issuing a plea for help. We implement each of these items in two different ways, resulting in an experiment with a full-factorial total of 32 (= 25) unique message alternatives.
One central innovation in our experimental design is the application of a reinforcement learning algorithm. This algorithm continuously adjusts the experimental group sizes toward better performing invitation messages—those that generate higher starting rates—unlike traditional setups with static group composition. As the experiment progresses, we apply a Bayesian decision rule known as randomized probability matching, which incrementally allocates more observations to the invitation messages with the highest likelihood of being optimal (Scott 2010). To maximize output, the basic principle of this adaptive randomization, often referred to as multi-armed bandit (MAB) optimization, is straightforward: Allocate more efforts (observations) to actions (invitation message alternatives) that appear most rewarding.
Our results underscore the significant impact of invitation message design on participation rates in web surveys targeting business decision-makers. We find that the most effective survey invitation message can increase starting rates by up to 44%. Specifically, we demonstrate that personalization, stressing the authority of the invitation’s sender, and pleading for help result in higher survey starting rates. By contrast, placing the URL near the top of the message and emphasizing strict data protection policies do not seem to significantly benefit survey participation. The latter result is particularly surprising as it suggests that an extended data protection statement does not unanimously heighten the trustworthiness of the survey invitation. Instead, extensive privacy assurances may also raise concerns about sharing sensitive information, reducing recipients’ willingness to respond in the first place. Moreover, by employing adaptive randomization we were able to increase the number of survey starts by approximately 7% compared to a traditional fixed-group design, illustrating the practical benefits of this dynamic approach in optimizing survey output.
We support our main findings with a series of supplementary analyses. First, we examine the effect of invitation message design on the likelihood of recipients not only starting but also completing the questionnaire. While invitation messages significantly influence initial participation, one might be concerned that certain messages—by raising expectations or introducing unintended perceptions—could negatively impact the likelihood of completing the questionnaire once started. However, among those who initiate the survey, our analysis reveals no significant differences in completion rates across invitation messages, indicating that the positive effects of optimized messages on starting rates translate into a higher number of completed responses without adverse effects on completion behavior. Second, we investigate whether responses to the invitation messages vary based on firm size. Our analysis reveals that smaller businesses are particularly responsive to pleading frames and invitations from authoritative sources. By contrast, larger businesses exhibit higher starting rates when the survey is personalized, but emphasizing the GBP’s compliance with privacy regulations appears to deter their engagement. Despite these heterogeneous treatment effects, we confirm that our experiment did not introduce size-related nonresponse bias. Specifically, we find no significant difference in staffing levels between respondents and non-respondents across the different experimental treatment conditions. Third, we show that our main findings are robust to the exclusion of participants from previous surveys conducted by the GBP. Finally, to address potential concerns about bias in standard errors due to adaptive randomization, we validate our findings using batched regressions (Kemper and Rostam-Afschar 2024, Zhang et al. 2020).
We make several contributions to the literature. First, we provide evidence from a large-scale, full-factorial experiment with 32 invitation messages, allowing for a simultaneous assessment of five message elements and their interaction effects. By contrast, prior studies have considered at most 16 invitation message alternatives (Kaplowitz et al. 2012). Additionally, we examine the impact of emphasizing compliance with data privacy regulations, an aspect with limited prior evidence despite its relevance for any self-administered survey. Second, we address calls for experimental research in establishment surveys, given that findings from household surveys do not necessarily generalize to business contexts (Langeland et al. 2023). In this regard, we offer novel insights, demonstrating, for example, that personalization can enhance response rates even when using business names rather than person names. Third, we illustrate how MAB optimization can be effectively applied to increase survey starting rates by dynamically adjusting the allocation of invitation messages. This research design leverages the staggered roll-out of invitations, allowing for regular updates to the randomization scheme. In doing so, we provide a practical example of how MAB optimization can be applied in survey research, offering a transferable approach for other contexts. For instance, this approach is useful when eliminating alternative questions or formats ex-ante is neither feasible nor desirable, or when survey content must be adapted to respondent characteristics.
We proceed as follows. In Sect. 2, we describe prior findings on survey invitation message design, while in Sect. 3 we introduce the concept of MAB optimization. In Sect. 4, we outline our experimental procedure. The main findings are presented in Sect. 5. After providing supplementary analyses in Sect. 6, we conclude in Sect. 7.
2 Invitation Messages for Self-Administered Surveys
The decision to participate in a survey is linked to a trade-off between the benefits and costs, both of which can be influenced by the organization conducting the survey (Hill and Willis 2001). While this cost-benefit framework applies to both household and business surveys, its specifics differ. In household surveys, benefits might include monetary incentives or the value of a personalized, engaging survey experience (Fan and Yan 2010). To reduce response burden in household surveys, organizations should carefully monitor factors such as the inclusion of sensitive or cognitively challenging questions and the length of the questionnaire (Hill and Willis 2001). By contrast, business surveys rely less on monetary incentives, typically offering largely indirect benefits tied to broader economic mechanisms (Snijkers et al. 2013). Beyond the resources required to complete the survey, response burden for businesses often arises from complex computations, mismatches between the requested data and firms’ internal records or terminology, a lack of authorization to answer certain questions, and, similar to household surveys, the overall length of the questionnaire (Haraldsen 2018).
Beyond the characteristics of the questionnaire itself, which may alter the actual costs and benefits of participation, the design of survey invitations plays a critical role in shaping the expected costs and benefits perceived by potential respondents (Fan and Yan 2010). Prior research from household surveys suggests that optimizing the structure and phrasing of survey invitations represents an effective strategy for increasing response rates (Keusch 2015). Key design choices include personalizing invitation messages, emphasizing the power and status of the sender, placing the survey link strategically, stressing compliance with data protection, and adopting a distinct request style. In the following, prior research on each of these elements is reviewed and contextualized within the business setting.
Personalizing survey invitations has been widely investigated in household and student contexts, across different survey modes. In these studies, personalization is typically operationalized by addressing the recipient by their first and/or last name. In mail surveys, this approach has been shown to raise response rates (Heberlein and Baumgartner 1978, Yammarino et al. 1991). Yet, evidence from web-based invitations is mixed. Several studies suggest that personalization enhances participation (Cook et al. 2000, Heerwegh 2005, Heerwegh and Loosveldt 2006, Heerwegh and Loosveldt 2007, Heerwegh et al. 2005, Joinson and Reips 2007, Muñoz-Leiva et al. 2010, Sánchez-Fernández et al. 2012, Sauermann and Roach 2013), however, others do not (Kent and Brandal 2003, Porter and Whitcomb 2003, Trespalacios and Perkins 2016, Wiley et al. 2009). Positive effects of personalization are often linked to reciprocity, where respondents feel a need to reciprocate a personal salutation (Dillman 2007), or responsibility theory, which suggests that individuals feel more obligated to help because a private request makes them uniquely accountable (Barron and Yechiam 2002).
While these findings are already inconclusive, their applicability to business contexts remains uncertain. In business surveys, the flow of information is more complex: Gatekeepers often control access to potential respondents, and identifying the most appropriate person to answer the survey is not always straightforward (Snijkers et al. 2013). In some cases, several individuals may be equally qualified to respond, while in others, the required data may be distributed across departments or functions, making it difficult for any single person to provide a complete response. This makes respondent selection less straightforward and typically beyond the direct control of the survey organization, complicating the use of personal names in salutations.2
Digital exchanges are typically characterized by high levels of anonymity. In the context of survey invitations, a lack of social information about the sender could lead to widespread disregard of the request. Stressing the high social status of the sender, however, may serve as a heuristic for decision-making, where recipients are more likely to trust and comply with requests from authoritative sources (Cialdini 2001). While several studies identify a positive response rate effect of making authority salient in survey invitation messages targeting individuals and households (Guéguen and Jacob 2002, Kaplowitz et al. 2012), others indicate no beneficial impact of emphasizing the high social status of the invitation’s sender (Heerwegh and Loosveldt 2006, Petrovčič et al. 2016, Porter and Whitcomb 2003). In the business context, authority can stem from the mandatory nature of certain surveys conducted by governmental institutions or national statistical institutes. However, in voluntary surveys—such as the one used for this experiment—the effect of authority signals, like the sender’s status or institutional power, remains an open question. While authoritative senders might increase the sense of obligation to participate as a contribution to the broader business community, businesses also perceive participation as a nonproductive cost (Snijkers et al. 2013), making the influence of authority uncertain.
To increase response rates in web-based questionnaires, survey organizations are advised to lower participation hurdles as much as possible (Crawford et al. 2001). If URL links are integrated into the invitation message, links with embedded identifiers are, thus, considered to achieve a higher willingness to participate as compared to links demanding the (burdensome) manual entry of an identification or password (Crawford et al. 2001). Beyond the URL’s structural form, research is concerned with the optimal placement of the participation link within the invitation message. On the one hand, Couper (2008) recommends placing the URL near the top of the invitation to avoid requiring recipients to scroll down for accessing the survey. For businesses, where costs are an immediate concern, a top-placed URL may seem advantageous by reducing perceived effort. On the other hand, Kaplowitz et al. (2012), in a university context surveying students and faculty, find that placing the URL at the bottom of the invitation is associated with increased participation, as this placement encourages potential participants to read more of the invitation, thereby enhancing the perceived trustworthiness of the request. In business surveys, building trust is crucial, as companies often question why they have been selected for participation and how their data will be used (Snijkers et al. 2013). A later URL placement that prompts careful reading of the invitation may help alleviate these concerns.
Emphasizing strict data protection policies could also add to the trustworthiness of a survey invitation. Information systems research indicates that the presence of a privacy statement on a firm’s website increases the likelihood that customers will share personal information (Hui et al. 2007). Similarly, Al-Natour et al. (2020) show that privacy uncertainty is negatively associated with consumers’ intention to download an app. If these observations apply to invitations for voluntary business surveys, highlighting the survey organization’s strict data protection policies could encourage firms to participate. However, stressing data protection may also alert firms to the possibility that they could be sharing proprietary or sensitive information, potentially reducing their willingness to respond. Additionally, particularly in larger organizations, emphasizing data protection may introduce (perceived) procedural hurdles, as decisions about who is authorized to respond can delay or prevent the invitation from reaching the appropriate recipient, ultimately lowering response rates.
Finally, survey participation behavior may be influenced by the way participation requests are framed. Researchers typically distinguish between an ‘offer’ frame, which invites recipients to share their opinions, and a ‘plea’ frame, which appeals for assistance. Considering the importance of the social norm of helping in online communities (Tanis 2007), several studies suggest that framing participation requests in a way that leverages recipients’ inherent willingness to assist can increase response rates in household surveys (Petrovčič et al. 2016, Porter and Whitcomb 2003, Trouteaud 2004). Yet again, this finding is not unanimously supported. For instance, Felix et al. (2011) find no significant differences in survey starting rates depending on the framing of the invitation. In business surveys, the relevance of the social norm of helping is less clear, as firms tend to view participation more transactionally, perceiving it as an investment in the response process that needs to pay off (Snijkers et al. 2013).
In sum, prior evidence on optimal survey invitation message design is largely inconclusive. Additionally, whether emphasizing a strict adherence to data protection rules increases survey participation has—to the best of our knowledge—not yet been examined. While existing studies on survey invitation design are predominantly focused on household or student surveys, the GBP targets business decision-makers of firms operating in Germany, whose participation decisions likely differ substantially from those of individuals approached in their private sphere (Snijkers et al. 2013). Given the absence of a unifying theory on survey participation (Keusch 2015) and the insufficient understanding of how intrinsic and extrinsic motivation influence business survey response behavior (Torres van Grinsven et al. 2014), determining which elements of invitation messages in the context of business surveys influence participation rates remains an open empirical question.
3 Adaptive Randomization in Experiments
All prior studies examining the impact of invitation message design on survey response rates share a feature in their research design: They are carried out as non-adaptive experiments using fixed and balanced randomization. This approach is characterized by an experimental phase consisting of plain exploration, i.e., learning about the effectiveness of different treatment conditions. Crucially, any of the information that is gathered during the experiment remains disregarded for the purpose of the ex-ante defined randomization strategy, and the exploitation of potentially identified treatment effects, i.e., earning on the knowledge that has been gained, only occurs after the experiment has concluded.3 This setup reflects a common evaluation criterion in research, where experiments are typically deemed efficient based on their statistical power to detect treatment effects (Breur 2016).
Yet, in case of sequential experiments, sticking with the maxim of fixed and balanced randomization might sacrifice output, in our context survey starts, for the sake of exploration. Even if preliminary results clearly point to superior performance in one experimental group early in the trial, this data is typically not leveraged until after the experiment has concluded. This lack of flexibility and the disregard of interim results make traditional experiments less attractive for organizations and firms, which tend to evaluate experiments based on their outputs not only after, but also during the trial phase (Kaibel and Biemann 2021).
In contrast to experiments that keep group sizes fixed in advance, response-adaptive randomization addresses these concerns by merging the exploration and exploitation phases of an experiment, so that any knowledge gathered during the experiment is already taken into account while it is still ongoing. To maximize some outcome, the basic idea of response-adaptive randomization is to assign more observations to treatments that appear most rewarding. The challenge of identifying a sequential randomization scheme that yields the largest possible (desirable) output from a set of potential treatments with unknown reward probabilities has become widely known as multi-armed bandit (MAB) problem—a metaphor referring to a gambler in a casino who needs to decide which slot machine to play for maximizing their monetary payoff.4
Determining response-enhancing design features in survey invitation messages directed at firm decision-makers represents a prime example of a MAB problem: While the reward probabilities (starting rates) of the individual message versions are unknown ex-ante, a goal of the GBP and, more broadly, of survey organizations is to increase overall survey participation.5 Rather than relying on traditional static experimental designs, this objective can be achieved through adaptive randomization in sequential setups, for which various MAB algorithms have been introduced.6
From the array of available MAB algorithms, we implement a policy called randomized probability matching to manage the exploration-exploitation trade-off in our experiment. As introduced by Scott (2010), this algorithm belongs to the class of Bayesian decision rules, which have recently gained popularity for solving MAB problems (see, e.g., Ferreira et al. (2018), Kandasamy et al. (2018) or Schwartz et al. (2017)).7 The general idea behind algorithms that apply a Bayesian decision rule is the following: Assuming some prior distribution on the parameters that characterize the reward distribution of each available option (in this case, invitation message alternatives), at every decision point, these options are chosen according to their posterior probability of being optimal (Agrawal and Goyal 2012). In our experiment, this implies that better-performing messages are sent out more often than those performing poorly. The term ‘Bayesian decision rule’ originates from the practice of updating the conjectured reward distributions after observing the successes and failures for each option, following Bayes’ rule.
Optimizing survey invitations can be modeled as a Bernoulli bandit problem due to the binary nature of the primary outcome measure: Either a firm decision-maker starts the survey in response to receiving a particular invitation message or not. To formalize the concept of randomized probability matching for Bernoulli bandits, consider an experiment with arms that promise ex-ante unknown, independent reward probabilities .8 As priors, reward probabilities for each arm are assumed to follow a Beta distribution. Recall that any Beta distribution is defined within the interval [0,1] and is characterized by two parameters, and . The expected value of a Beta random variable is given by . Thus, the distribution is skewed to the left if and skewed to the right otherwise. Larger values of and correspond to reduced variance in the distribution.
Prior to the start of the experiment, all arms i are assumed to have Beta priors , representing a uniform distribution over the interval [0,1]. This premise reflects the lack of ex-ante knowledge about the arms’ individual reward probabilities. What makes Beta distributions a convenient choice is that they are conjugate to Bernoulli likelihoods, meaning that if you assume a Beta prior and conduct an experiment with Bernoulli outcome, the posterior will also be Beta. More formally, let denote the number of successes and the number of failures observed for arm i until period t. The posterior distribution of is updated as . Accordingly, the joint posterior distribution of is
where represents the sequence of rewards observed up to time t across all arms. Following Scott (2010), by way of integration or simulation, the probability that arm i is optimal at time t can be derived as
These probabilities determine the adaptive randomization scheme during the experiment, serving as distribution weights according to which each invitation message alternative is sent out. Their derivation in (2) reflects a simple intuition: While the integral of the Beta posterior for arm i’s reward probability density function within [0,1] naturally equals 1, the probability of selecting arm i—and also its corresponding distribution weight—decreases as the posteriors of other arms indicate higher expected rewards based on their observed successes and failures.
Randomized probability matching is characterized by a number of desirable properties. First, calculating the individual distribution weights is rather simple, requiring only the input of successes (surveys started) and failures for each arm (invitation message alternative).9 Second, randomized probability matching has been proven to be effective in maximizing the desired outcome. Scott (2010) shows that this decision rule outperforms simpler heuristics and other MAB algorithms. This might be due to the fact that using a Bayesian decision rule reduces the likelihood of becoming trapped with an early bad choice (Agrawal and Goyal 2012). To further mitigate this risk, it is common to implement Bayesian algorithms with a burn-in phase, during which all arms are chosen at equal rates (Du et al. 2018, Kaibel and Biemann 2021), and to impose a clipping constraint forcing a minimum distribution weight on each message alternative. By introducing a burn-in phase, the impact of outliers on the resulting sampling scheme is averaged away and statistical power is strengthened (Kaibel and Biemann 2021).10 Third, randomized probability matching is compatible with batch updating, i.e., when arms are not chosen one at a time. For these batches, treatment allocation occurs proportionally to the calculated distribution weights. Finally, randomized probability matching does not require discretionary tuning parameters to reduce exploration over the course of the experiment (Scott 2010). Instead, the randomization scheme evolves endogenously based on each arm’s posterior probability of being optimal.
4 Experimental Procedures and Data
We implement our experiment within the infrastructure of the German Business Panel (GBP).11 The GBP operates on a recurring six-month cycle, contacting a random sample of firms across Germany for which digital contact information is available. The contact pool is primarily sourced from Bureau van Dijk’s Orbis database, a large commercial data platform providing extensive coverage of both public and private firms in Germany. The sampling process follows simple random sampling, and as Bischof et al. (2024) demonstrate, respondent firms closely resemble their population counterparts in key characteristics such as industry, firm size, and legal form. The target population comprises the universe of legal entities included in the official German Statistical Business Register. To address potential coverage error, the GBP provides survey weights calibrated to the marginal distributions of this target population.12
For its web survey, the GBP engages its entire contact pool exclusively via email, with invitations distributed daily over the course of each six-month interval, excluding weekends and public holidays. Each workday, a randomly drawn subset of firms is contacted, and non-respondents receive reminders after seven, 14, and 28 days. Importantly, firms are only contacted once per wave and are not reintroduced into the contact pool during the same period. The survey infrastructure of the GBP is fully web-based. Thus, answering the survey is self-administered, typically taking respondents between five to 15 minutes to complete. No monetary incentives are provided for participation. Broadly speaking, the GBP’s goal is to gather insights from firm decision-makers on topics related to accounting, taxation, and transparency regulation. Most responses come from top-level executives, including owner-managers, CEOs, and CFOs (Bischof et al. 2024).
For the experiment, which ran from August 16, 2022, to November 25, 2022, we utilized a 15-week window within one of the GBP’s six-month survey intervals. The structural features of the GBP make it an ideal environment for implementing an MAB approach. Distributing survey invitations in daily batches, rather than all at once, enables adaptive randomization. Moreover, the GBP’s infrastructure provides prompt feedback on successes (survey starts) and failures (non-participation), allowing us to track the performance of each invitation message. For every firm contacted, the system records timestamps indicating when the email was sent and opened, and whether the survey was started and completed, thereby facilitating timely adjustments to the randomization scheme throughout the experiment. During the 15 weeks of the experiment, a total of 176,000 contacts opened their invitation message within one week of receiving it; 7833 started, and 3733 completed the survey.13
Message Design Alternatives.
We vary five invitation message characteristics that are potentially relevant for influencing survey starting rates in voluntary business surveys. As outlined in Table 1, each of these five treatment elements is implemented in two forms, which are coded as 0 or 1 for tracking purposes. By compiling all combinations of these characteristics, we generate 32 () distinct invitation message alternatives. Thus, our experiment has a full-factorial design.
A key distinction of this experiment, compared to prior studies, is its focus on a business survey context, which necessitates tailoring the personalization treatment for firm decision-makers. We consider an invitation to be personalized if it includes the name of the legal entity the respondent is reporting on (“[…] we would like to cordially invite you—on behalf of your business [business name]—to participate […]”). While surveys of individuals typically personalize invitations using the recipient’s name, this method is not appropriate for business surveys, where multiple decision-makers, such as CEOs or CFOs, may be eligible to respond. As a result, targeting a specific individual risks addressing someone who may not be the most relevant respondent. Moreover, personal names may not be included in the sampling frame, or the available contact details could be outdated, further complicating the use of personal salutations.
In addition to personalizing the invitation message, we generate experimental variation by manipulating the authority of the invitation’s sender. To signal higher authority, the email signature explicitly lists the full academic and honorary titles of the GBP’s principal investigators, along with their university affiliations. By contrast, a lower-authority version presents the senders’ plain names, omitting titles and affiliations. We also vary the placement of the survey URL link, displaying it either in the upper part of the message, after a brief introductory passage, or at the bottom, before the email signature. Furthermore, the invitation messages differ in their emphasis placed on data protection. One version briefly mentions the GBP’s strict data protection policies within a larger text block, while another version features a separate text block with a bold headline, specifically highlighting the GBP’s commitment to privacy protection. Lastly, we modify the phrasing of the participation request by altering the message’s framing. In the offer condition, recipients are invited to take part in the survey and share their insights on the perceived effects of tax and accounting-related regulation (“[…] we would like to cordially invite you […]”; “The information you provide helps us to understand the effects […]”; “Thank you for your participation!”). In comparison, the plea condition frames the message as a call for advice and help (“[…] we ask you for participation […]”; “Only with your information can we help to understand the effects […]”; “Please help by participating!”).
As indicated in Table 1, we use a combination of acronyms and codes to reference the 32 distinct message alternatives in later analyses. For instance, the invitation message labeled as P0A1U1D0M0 does not include the recipient’s business name, but it does mention the academic titles and university details of the sender. In this version, the participation link is positioned in the upper part of the message, and no emphasis is placed on data protection. Finally, this message offers recipients an opportunity to share their opinions rather than issuing a plea for help. The exact wording of each treatment variation is detailed in Appendices Fig. B.1 and Fig. B.2, which contain the original German versions of the invitation messages. Their English translation is provided in Appendices Fig. B.3 and Fig. B.4. An important caveat from prior literature is the observation that participation rates may be influenced not only by the content of an invitation message, but also by its length (Kaplowitz et al. 2012). To avoid such confounding effects, we refrain from modifications that materially alter the length of the invitations.
Table 1 Overview of Treatments
(1) Characteristic | (2) Acronym | (3) Coding: 0 | (4) Coding: 1 |
This table summarizes the five distinct message treatments that generate the experimental variation in our study. Column (1) lists the characteristics that are modified to create the set of invitation messages, with abbreviations for each characteristic shown in column (2). Columns (3) and (4) describe the two specifications for each characteristic, coded as 0 or 1. A combination of these acronyms and codes is used to reference a particular invitation message alternative. For example, the invitation message P0A1U1D0M0 excludes the recipient’s business name, includes the senders’ academic titles and university affiliations, places the participation link near the top of the message, does not emphasize data protection, and invites participants to share their opinions. For the exact wording of each treatment in its two versions, see Appendices Fig. B.1 and Fig. B.2 as well as Fig. B.3 and Fig. B.4. |
Personalization | P | No mentioning of business name | Mentioning of business name right after salutation |
Authority | A | Sender: Names (without titles) and GBP | Sender: Names with titles, universities and GBP |
URL | U | Bottom: Before signature | Top: After brief introductory paragraph |
Data Protection | D | No emphasis: Single sentence within a textblock | Emphasis: Separate textblock with two strongly phrased sentences |
Message Frame | M | Offer | Plea |
When implementing a Bayesian decision rule for MAB optimization, it is generally advisable to incorporate a burn-in phase to lower the risk of getting locked into sub-optimal randomization decisions in the beginning of the experiment (Du et al. 2018). During this phase, all invitation message alternatives are distributed at equal rates. The optimal length of the burn-in phase involves a trade-off: While a longer phase reduces the likelihood of premature, inefficient exploitation, it may also result in avoidable foregone survey starts by not prioritizing better-performing messages sooner. Recommendations on the optimal length of the burn-in phase vary drastically depending on the research objective and the conjectured differences in effect sizes between the experimental groups. For instance, Kaibel and Biemann (2021) suggest that adequate burn-in phases range from only ten or 20 subjects per treatment condition, if an experimenter is primarily interested in identifying the most effective treatment condition, to half of the total sample size, if the experimenter aims at determining significant treatment effects for all experimental treatment conditions. Extended burn-in phases are particularly advisable when effect size differences are expected to be small and a substantial number of experimental groups are being compared. Based on prior survey waves of the GBP, we know that starting rates are typically below 10%. While we expect the phrasing of invitation messages to influence firms’ likelihood of participation, we anticipate that these effects will be moderate. To avoid any negative impact of the experiment on the number of survey starts stemming from inefficient, early MAB choices (that would be the result of unfortunate coincidence), we adopt a conservative strategy, extending the burn-in phase to four out of the overall 15 experimental weeks.
Figure 1 schematically illustrates the experimental procedure. During the initial four experimental weeks, all invitation messages are sent out at equal rates, i.e., the email distribution weights are constant and amount to . During these four weeks, the procedure mirrors an experiment with fixed and balanced randomization. From week five onward, we implement the MAB algorithm as outlined in Sect. 3. Each week, the algorithm evaluates the participation data to estimate the probability of each invitation message maximizing survey starting rates. Consequently, better-performing invitations are sent out more frequently as the experiment progresses. The MAB algorithm iteratively updates the distribution weights by incorporating data from all preceding weeks. For example, the weights for week five are informed by the outcomes from the first four weeks, while those for week six incorporate data from the first five weeks. This iterative process continues throughout the experiment.

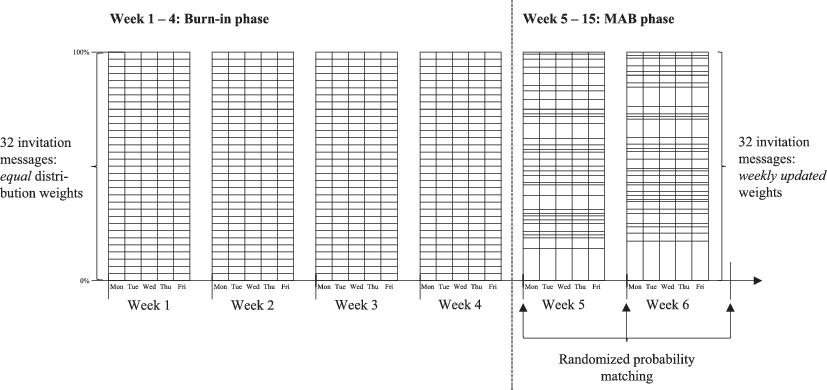
Fig. 1 Stylized Experimental Procedure with Adaptive Randomization. Each column in this stylized figure represents the distribution of the 32 invitation message alternatives on a single workday. The size of a rectangle illustrates the distribution weight of an individual message alternative. During the first four weeks—the burn-in phase—all messages are distributed equally. From week 5 onward, the MAB algorithm adjusts the weighting of each message version based on its posterior probability of being optimal. Within a given week, these weights remain constant. A clipping constraint ensures that each message alternative receives at least four allocations per day, with the remaining daily contacts distributed randomly among the other message versions according to their weights.
The implementation of the MAB procedure requires recurring assessments of participation statistics for each invitation message alternative. To calculate the weekly distribution weights in our experiment, the MAB algorithm uses two key inputs: a vector representing the number of firms that received and opened each survey invitation message, and a vector indicating how many of these firms started the questionnaire after opening the invitation.14 Accordingly, the success metric for each invitation message alternative is its starting rate, defined as the proportion of firms that started the survey among those that opened the respective message. We use opened messages as the baseline for this calculation, as the invitation can influence participation decisions only if it at least has been opened.
Operationally, this data is accessible via the GBP’s survey infrastructure. At the end of each experimental week, we retrieve the distribution history of prior emails, which specifies whether firms received and opened the survey invitation, as well as whether they subsequently started answering the questionnaire. This data is then matched with stored information on which invitation message alternative was randomly assigned (according to the calculated distribution weights) to each business contact. By combining these data points, the MAB algorithm generates updated weights, which are applied to the distribution of invitation messages for the following week.
Realized Distribution Weights.
While Fig. 1 illustrates our experimental procedures schematically, Fig. 2 displays the realized cumulative distribution shares of each invitation message alternative throughout the course of the experiment. During the initial four weeks—the burn-in phase—the distribution weights remained constant by design. In this 4‑week period, approximately 1500 firms opened each invitation message, resulting in a total of roughly 48,000 observations.

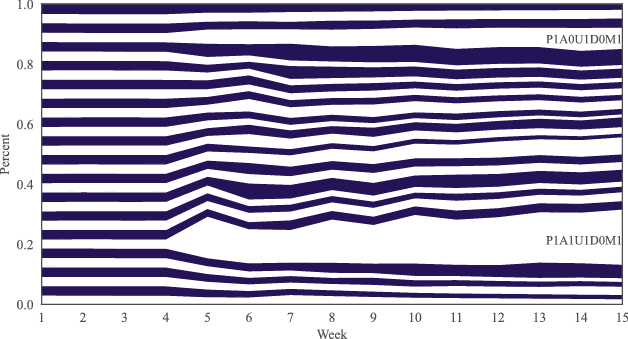
Fig. 2 Realized Cumulative Distribution Weights of Message Alternatives. This figure shows the cumulative distribution share of the 32 invitation message alternatives over the course of the experiment. Each blue and white segment represents the cumulative distribution share of a specific message version. As per the experimental design, distribution weights remained constant at during the first four weeks. Afterward, the MAB algorithm adjusted the distribution, increasing the weight for better-performing alternatives and decreasing it for message versions with weaker performance.
Beginning in week 5, the MAB algorithm assessed the success rate of each message version, defined as the proportion of opened emails that led to a survey start, and gradually allocated more weight to the more successful invitation alternatives. Over time, the message version P1A1U1D0M1 was particularly favored by the algorithm. Another example of a message that received a disproportionately high number of observations is P1A0U1D0M1. These shifting distribution weights reflect the observed differences in starting rates across the invitation message alternatives, as outlined in Section 5.1. Importantly, we ensured that at least four invitations of each message alternative were sent per workday, placing a clipping constraint on the distribution weights to guarantee that each option was tested in every batch.
From the GBP’s overall half-year contact pool, firms are randomly assigned to specific workdays throughout the survey wave. On each workday, these contacts are then randomly allocated to invitation message variants according to their weekly updated distribution weights. This procedure is intended to balance firm characteristics across the experimental groups. Because firms are first randomly allocated to workdays before any adaptive weighting occurs, the covariate distribution is stationary over time, so a standard cross-arm comparison of baseline variables remains appropriate. The effectiveness of our randomization process is validated in Fig. A.1, which shows that the average number of employees per firm, logged due to the high skewness in firm size, and the geographic distribution of recipient firms, measured by the share located in the former East Germany, are comparable across all message variants sent during the optimization phase of the experiment. Fig. A.2 provides a more granular view of the spatial distribution of sent invitations, ranked by each message version’s cumulative distribution share. Naturally, as the share of invitations increases, more firms are reached, particularly in densely populated areas. However, the spatial pattern remains consistent, even as distribution weights expand, indicating no specific geographic clustering for any message variant.
When evaluating the performance of each invitation message version and updating the distribution weights, we only consider a firm contact if the respective message was opened. Two concerns related to this procedure may arise. First, there could be inaccuracies in the survey software’s ability to detect whether a message was opened, but this would only be problematic if these detection errors were message-specific. Second, there may be differences in the likelihood of individual messages being opened, for example, if spam filters respond differently to the placement of the URL link. If spam filtering or other message characteristics were affecting opening rates, we would expect systematic differences across message alternatives. Fig. A.3 addresses these concerns and demonstrates that the opening rates are very similar for each message version. Both a Wald test and pairwise t‑tests on the equality of shares of opened survey invitations across message versions show no significant differences (smallest p-value = 0.456), alleviating concerns about biases in opening rates.
5 Results
5.1 Which Invitation Messages Yield More Survey Starts?
To structure the analysis of the experiment’s results, we first evaluate the performance of the individual invitation message alternatives. Figure 3 displays the linear prediction of each message’s starting rate, conditional on participants opening the survey invitation email. The graph also highlights two mean values: the average realized starting rate (in red), which incorporates the varying distribution weights assigned through MAB optimization, and the equally-weighted mean starting propensity (in black), which assumes uniform distribution across all message alternatives, i.e., . The latter mean value serves as a natural benchmark for assessing the performance of MAB optimization, which is discussed in greater detail in Section 5.3.

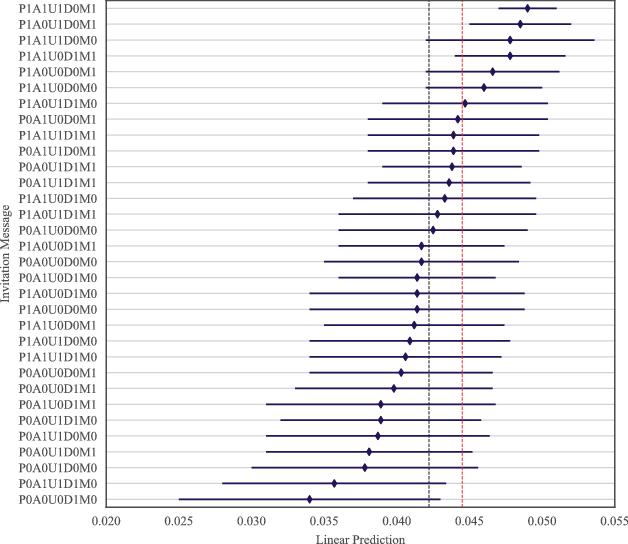
Fig. 3 Prediction of Starting Rates. This figure presents OLS margins for the starting rates of each message alternative as well as their 95% confidence intervals with robust standard errors. The starting rate is defined as the share of firms that commence the survey after opening the invitation email. The two dashed vertical lines represent different mean values: the red line indicates the average starting rate based on the realized distribution during the experiment (with MAB optimization), while the black line shows the equally weighted average starting rate across all message versions. Thus, the black line approximates the starting rate of an experiment with fixed and balanced randomization.
After 15 experimental weeks, we observe considerable differences in starting rates between the individual message alternatives. While the equally-weighted average starting propensity (in black) amounts to 4.2%, individual starting rates range from 3.4% to 4.9%. Thus, sending the best-performing invitation, P1A1U1D0M1, instead of the message alternative with the lowest starting rate, P0A0U0D1M0, increases the likelihood of a manager starting the survey upon having opened the invitation message by 43.9%.
An examination of Fig. 3 and the confidence intervals for each invitation’s predicted starting rate reveals a noteworthy trend: Messages with higher starting rates tend to have narrower confidence intervals, while weaker-performing messages show wider confidence bands. This pattern reflects the weighting procedure inherent in MAB optimization, allocating greater weight to messages associated with higher survey starts.15 For instance, the invitation message alternatives with the highest predicted starting rates (P1A1U1D0M1 and P1A0U1D0M1) received disproportionately high distribution weights through adaptive randomization, as shown in Fig. 2.
5.2 Which Treatments Increase Starting Rates?
Upon closer examination of Fig. 3, it appears that the observed ranking of the invitation message alternatives is driven by differences in performance of the treatment elements, rather than occurring by chance. Notably, the message version with the highest average starting rate, P1A1U1D0M1, is the exact inverse of the worst-performing invitation, P0A0U0D1M0, with each treatment having the opposite specification. This pattern suggests that individual message attributes may play a crucial role in influencing survey participation. To formally assess this relationship, we analyze the treatment characteristics underlying the message designs using a conjoint framework. Specifically, we estimate a model in which the binary survey initiation indicator (1 if started, 0 otherwise) is regressed on the individual characteristics of the received message (P, A, U, D, M). Figure 4 presents the corresponding Average Marginal Component Effects (AMCEs), which indicate the causal impact of each treatment characteristic on the starting rate.16

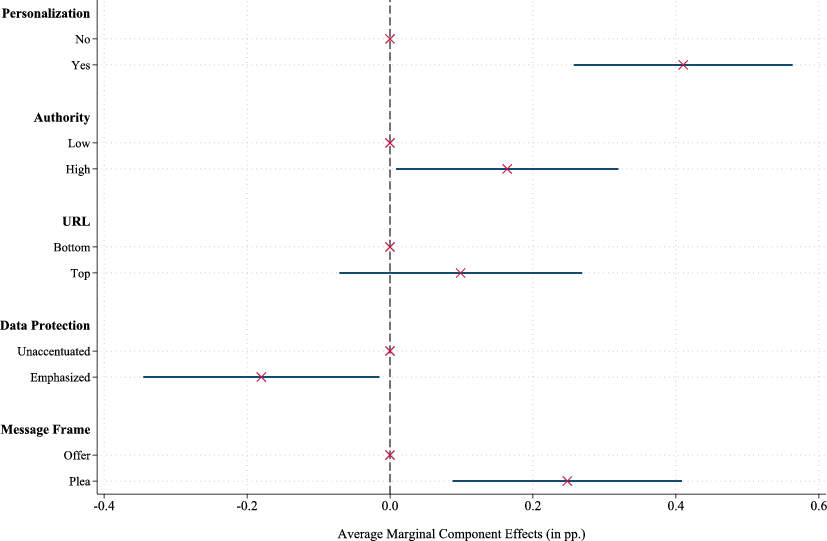
Fig. 4 AMCEs on the Starting Rate. This figure presents Average Marginal Component Effects (AMCEs) from a conjoint analysis. The dependent variable is a binary indicator coded as 1 if a message recipient, who opened the invite, subsequently started answering the questionnaire (0 otherwise). The AMCE denotes the marginal effect of changing an invitation message’s attribute averaging over the joint distribution of the remaining attributes. Whiskers indicate 95% confidence intervals with standard errors that are clustered at the message level. The number of observations (firms that opened the survey invitation message) amounts to 176,000.
The conjoint analysis suggests that personalization, high authority, and pleading for help are associated with higher survey starting rates. Fig. 4 shows that personalization significantly increases the starting propensity by 0.41 percentage points (p-value: < 0.001). High authority and pleading for help also increase starting rates by 0.16 (p-value = 0.039) and 0.25 percentage points (p-value = 0.004), respectively. In relative terms, these effects represent modest increases given the overall low baseline starting rate. For instance, compared to the marginal mean of 4.12% for unpersonalized invitations, personalizing the message increases the starting rate by 9.95%.
The placement of the URL link, whether near the top or at the bottom of the invitation, does not significantly impact the starting rate.17 By contrast, emphasizing data protection in the invitation is negatively related to the starting rate. Highlighting strict data protection policies reduces the starting propensity by 0.18 percentage points (p-value = 0.034), which contradicts the expectation that such emphasis would alleviate privacy concerns and encourage participation. Instead, it seems that stressing compliance with data protection makes data security issues more salient—particularly in a business context—causing managers to be more cautious about sharing proprietary information. This heightened awareness might reduce their willingness to respond to the survey.
5.3 MAB Optimization vs. Static Experiment
MAB optimization balances exploration and exploitation in sequential experiments and should improve outcomes compared to static group composition. In this section, we quantify the additional survey starts achieved through reinforcement learning using randomized probability matching. To do so, we construct a counterfactual group mimicking a fixed and balanced randomization scheme. By design, in a static experiment, the distribution weights per invitation message would remain constant () throughout the experimental phase.
With fixed and balanced randomization during the burn-in phase, optimization—and any resulting performance improvement—begins only once the algorithm starts adjusting distribution weights. Using each message’s mean starting rate, we predict the expected number of survey starts under a purely fixed and balanced randomization scheme and compare this to the realized survey starts under the MAB procedure. Table A.2 contains the detailed results. Relative to the 5735 survey starts that were recorded after the burn-in phase of the experiment, a static design would have been expected to generate 5377 starts over the same period. As intended, MAB optimization reduced the number of foregone responses by prioritizing better performing invitations. Specifically, MAB optimization resulted in 358 additional survey starts, representing a 7% increase compared to a traditional static randomization setup. These gains have to be viewed in light of the experiment’s strong emphasis on exploration. A more exploitation-focused design with a shorter burn-in phase, lower batch size, and fewer arms could have increased starts further.
6 Supplementary Analyses
6.1 Treatment Effects on the Completion Rate
Our main analysis has shown that specific characteristics of a survey invitation message targeted at businesses influence their propensity to start answering the questionnaire. In this section, we examine whether these effects persist beyond the decision to start the survey, focusing on the likelihood of completing it. To do so, we condition our analysis on businesses that began the survey and replace the dependent variable with a binary indicator set to one if a firm decision-maker completed the questionnaire. Fig. 5 presents the corresponding AMCEs from a conjoint analysis on the completion rate. The results indicate that, once a manager has started the survey, the specific characteristics of the invitation message no longer significantly affect the probability of completing the questionnaire. None of the AMCEs are statistically significant at conventional levels, suggesting that, after the decision to start, message attributes do not influence the likelihood of survey completion. Thus, considering both the impact on survey starts and completions, improvements in message design ultimately increase the total number of completed responses by motivating more managers to begin the survey, without negatively affecting the likelihood of finishing it once started.

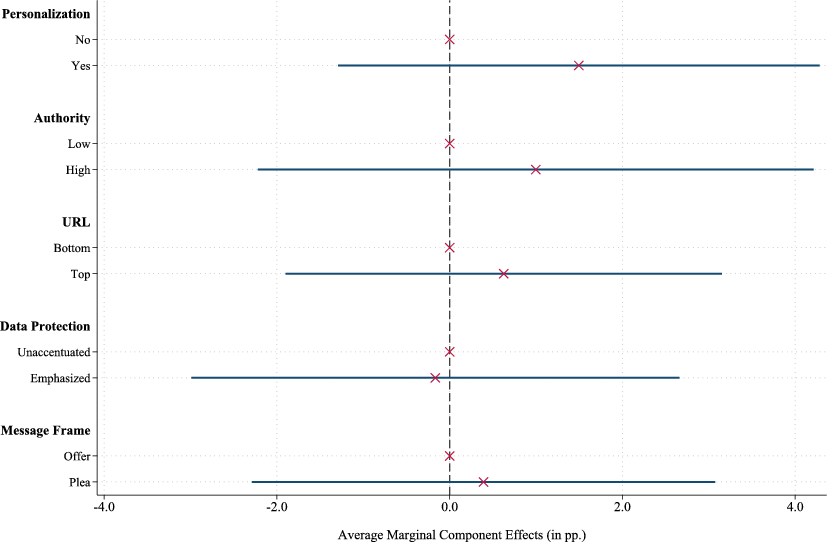
Fig. 5 AMCEs on the Completion Rate. This figure presents AMCEs from a conjoint analysis, where the dependent variable is a binary indicator set to 1 if a survey respondent completed the questionnaire after starting the survey (0 otherwise). Whiskers indicate 95% confidence intervals, with standard errors clustered at the message level.
6.2 Heterogeneous Treatment Effects
This section explores heterogeneous treatment effects, focusing on whether firms of different sizes respond differently to specific invitation message characteristics. To investigate this, we split the sample according to the number of employees, using staffing data available from Bureau van Dijk’s Orbis database for 138,380 out of the 176,000 firms that opened their invitation message. The median number of employees within this sample is four. Fig. 6 presents the AMCEs of different invitation message characteristics on the starting rate for firms with employee counts at or below the median as well as for firms with above-median employees.

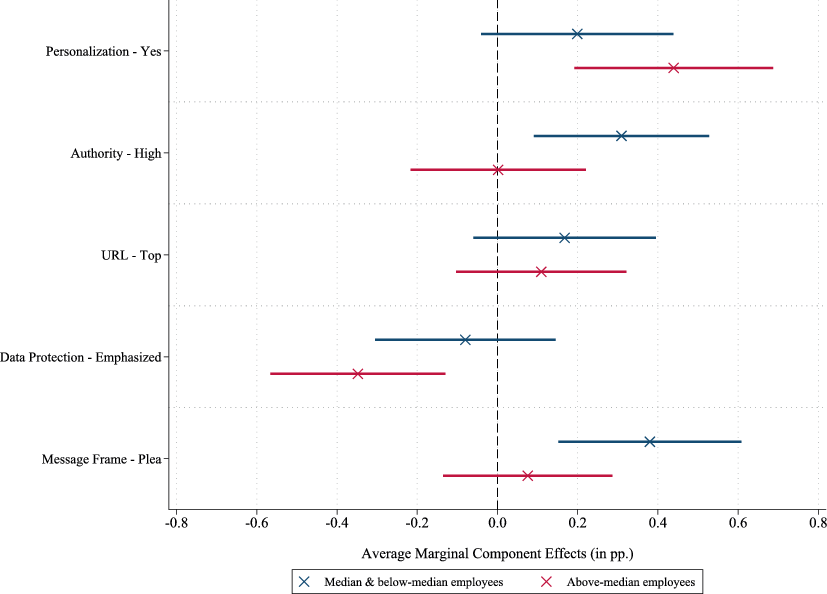
Fig. 6 AMCEs Depending on a Firm’s Size. This figure presents the AMCEs from two separate conjoint analyses, where the outcome variable is an indicator equal to one if a respondent initiated the survey and zero otherwise. The sample is split by firm size, based on the number of employees as reported by Bureau van Dijk’s Orbis database for 138,380 of the 176,000 survey recipients. The median number of employees is four. Error bars represent 95% confidence intervals, with standard errors clustered at the message level. Unlike previous figures, this one omits the baseline levels, but instead highlights the marginal effect of activating each attribute for the two subgroups.
The results indicate that smaller firms appear to be particularly receptive to messages issued by a source with high authority or framed as a plea for help. By contrast, larger firms are more likely to engage with personalized invitations, while emphasizing data protection appears to reduce their willingness to participate. One possible explanation for this finding is that larger firms face higher risks when sharing sensitive information. Additionally, highlighting data protection may create the impression that employees may not be authorized to respond, introducing perceived procedural hurdles that can discourage survey participation.
In Appendix A, we analyze whether these heterogeneous treatment effects result in nonresponse bias. Table A.3 indicates that staffing numbers do not significantly differ between firms that started the questionnaire and those that did not, across treatment characteristics.18 In aggregate, nonresponse bias does not appear to be introduced, likely due to the large number of observations per experimental group and the moderate size of the treatment effects. While contextualized bandits could tailor messages to recipients based on characteristics such as firm size (Hoffmann et al. 2023), this approach may increase the risk of bias.
6.3 Excluding Prior Participants
Due to the panel structure of the GBP, some businesses approached during this experiment had participated in previous survey waves. In principle, potential confounding effects from prior participation are mitigated through our randomization procedure, which ensures that prior participants and non-participants are proportionally distributed across the experimental groups. Additionally, we conduct a robustness test that excludes all 1208 firms that had previously completed a GBP questionnaire from consideration.
The results of the corresponding conjoint analysis are shown in Fig. 7. They remain largely consistent with those in the main specification. Personalization and pleading for help significantly increase response rates compared to unpersonalized invitations and offer frames. The effects of emphasizing authority and data protection are no longer statistically significant at the 5% level. Nonetheless, the analysis still suggests that emphasizing data protection in the invitation message does not improve survey participation.

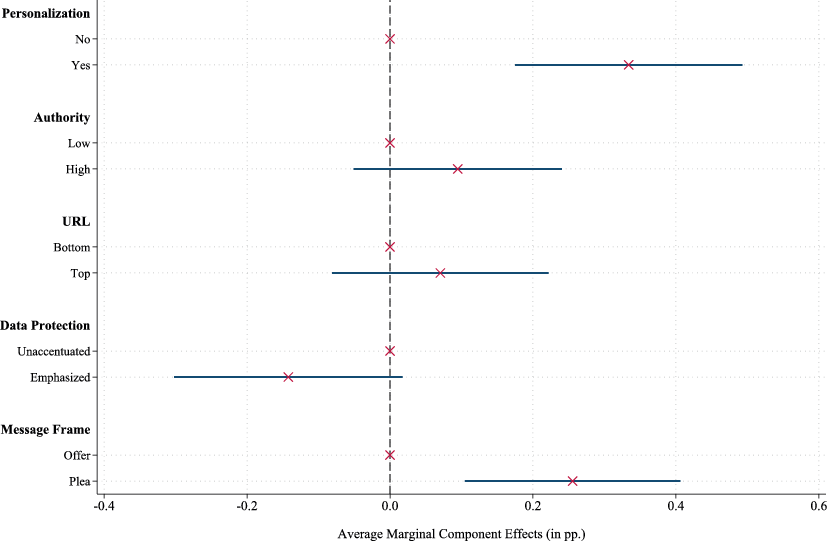
Fig. 7 AMCEs Given No Prior Participation. This figure presents AMCEs from a conjoint analysis. The dependent variable is a binary indicator set to one if a respondent who opened the invitation subsequently started the questionnaire (0 otherwise). The analysis is limited to businesses that had not participated in any prior GBP survey. Of the 176,000 recipients who opened the invitation, 1208 had previously completed a GBP survey and are excluded from this analysis. Whiskers represent 95% confidence intervals, with standard errors clustered at the message level.
7 Conclusion
This study investigates which elements of an email invitation encourage business decision-makers to participate in a self-administered survey. While extensive research exists on household surveys, its findings do not automatically transfer to business contexts, where distinct constraints shape engagement with survey requests. Our full-factorial experiment shows that personalizing the message, highlighting the sender’s authority, and framing the invitation as a plea for help increase the likelihood that managers begin the survey. Notably, personalization is achieved by referencing the company rather than an individual, underscoring its applicability in corporate settings. In contrast, altering the survey URL’s placement within the email has no discernible effect on participation rates. Emphasizing data protection appears to discourage participation, particularly among larger firms, possibly due to concerns about sharing sensitive information or the perception that responding requires additional internal authorization, increasing perceived procedural hurdles.
These findings should be interpreted with caution when applied to other contexts, as this study examines a German corporate environment. For example, establishing high authority in different cultural settings may require alternatives to referencing academic titles or university affiliations. Moreover, the economic significance of our results must be carefully considered. The effects we observe are modest, which is expected given the generally low levels of engagement in web surveys and the subtle nature of the tested interventions. Additionally, the large number of experimental groups in a full-factorial design inherently leads to smaller effect differences. While even small improvements in starting rates can meaningfully increase overall response numbers in large-scale surveys like the GBP, this does not imply that smaller surveys cannot benefit from our findings. The decision to implement these strategies should generally balance potential gains against administrative costs. Adjustments such as leveraging a high-authority sender or modifying the invitation’s framing require minimal effort and offer cost-effective improvements. By contrast, personalization—while effective—entails greater administrative effort, such as acquiring company-specific data, and thus requires careful consideration of its cost-benefit tradeoff.19
Our experimental design is innovative in that it employs MAB optimization instead of traditional fixed and balanced randomization. The core idea of MAB optimization is to balance learning about the performance of experimental groups (exploration) and leveraging accumulated knowledge to enhance outcomes during the experiment (exploitation). To manage this trade-off, we implement a Bayesian decision rule, randomized probability matching, which offers several advantages. This approach not only maximizes output more effectively than simpler heuristics but also maintains acceptable levels of statistical power (Scott 2010). With a sufficiently large burn-in phase, a clipping constraint that ensures a minimum level of exploration, and adequately sized batches (we recommend at least 20 observations, see Kemper and Rostam-Afschar (2024)), the algorithm minimizes the risk of prematurely locking into suboptimal choices. The required input consists solely of the number of successes and failures per experimental group, and because the decision rule operates without tuning parameters, it avoids assumptions about reducing exploration over time. Using this approach, we increased survey starts by 6.7% compared to a traditional fixed and balanced randomization scheme.
While MAB optimization offers advantages, it also involves administrative costs and requires specific conditions for implementation. First, MAB optimization is only feasible in sequential experiments where the randomization scheme can be updated. In settings where this is not naturally possible, partitioning the sample or identifying early-measurable outcomes may enable sequential updates. Second, MAB optimization relies on having a clear output to optimize, which may not always be the case in experiments lacking well-defined research questions or hypotheses. When an experiment is output-oriented, it becomes crucial to carefully select the right variable for optimization. In our study, survey starts per opened message served as a natural choice. However, had certain message characteristics negatively affected completion rates, optimizing for survey starts alone would have been suboptimal. Third, MAB optimization relies on timely data collection and an infrastructure that allows dynamic adjustments to the randomization scheme. This requires not only the recurring calculation of distribution weights but also their integration into the experimental process, generating implementation costs. Fourth, when margins are small—particularly with many arms—conventional hypothesis tests based on OLS may fail. Reporting results from batched OLS can help mitigate this issue (Kemper and Rostam-Afschar 2024, Zhang et al. 2020). Lastly, most algorithms assume stable reward distributions over time. If seasonal response patterns or other non-stationary factors emerge, the algorithm may over-explore and underperform (Liu et al. 2023). Addressing this requires modeling time dynamics, adding further analytical and administrative complexity.
Despite these challenges, MAB optimization represents a promising alternative to fixed and balanced randomization, particularly in experiments where maximizing output is a priority. Researchers typically assess experimental efficiency based on statistical power, whereas firms and organizations focus on optimizing outcomes. MAB optimization bridges these objectives, offering a pathway to more effective experimentation in business contexts and surveys. Potential applications include questionnaire design, adaptively randomized information provision, and vignette experiments. Future research could extend our experimental design in several ways. One avenue is the use of contextual bandits, which integrate participant characteristics into the decision-making process. For example, tailoring the randomization scheme based on firm size could have further enhanced our experiment’s effectiveness. However, contextualizing the bandit requires prior (data) knowledge and increases complexity (see, e.g., Hoffmann et al. (2023) for an application in online job platforms). Alternatively, in scenarios where rapidly identifying the best-performing experimental group is the priority, pure exploration bandits could be a useful alternative, even when it implies sacrificing short-term output. More broadly, MAB optimization could become a cost-effective tool for survey experiments once commercial survey software providers integrate it into their platforms.
1 Supplementary Information
Appendix We are grateful for the insightful comments and suggestions provided by an anonymous associate editor and three anonymous reviewers, seminar participants at the University of Mannheim and the Leibniz Centre for European Economic Research (ZEW) as well as attendees at the 45th Annual Congress of the European Accounting Association in Helsinki, the 10th Conference of the European Survey Research Association in Milan, and the 2023 TRR 266 Annual Conference. We thank Stefan Bender, Guillaume Bied, Torsten Biemann, Joachim Gassen (discussant), Morgane Hoffmann, Jan Kemper, Michael Knaus, Charly Marie, Bertille Picard, David Preinerstorfer, and Christof Wolf for their valuable feedback and advice. Funding from the German Research Foundation (DFG) for the project ‘Accounting for Transparency’ (Grant No.: SFB/TRR 403041268) is gratefully acknowledged. Johannes J. Gaul and Thomas Simon thank the Graduate School of Economic and Social Sciences at the University of Mannheim for financial support. This experiment was pre-registered in the AEA RCT Registry (AEARCTR-0009801). The original dataset underlying the analyses is openly available at https://doi.org/10.7802/2836. All errors are our own.
References
Agrawal, S., & Goyal, N. (2012). Analysis of thompson sampling for the multi-armed bandit problem. In S. Mannor, N. Srebro & R. C. Williamson (Eds.), Proceedings of Machine Learning Research. Proceedings of the 25th Annual Conference on Learning Theory. (Vol. 23, pp. 39.1–39.26). Edinburgh: PMLR. a, b
Al-Natour, S., Cavusoglu, H., Benbasat, I., & Aleem, U. (2020). An empirical investigation of the antecedents and consequences of privacy uncertainty in the context of mobile Apps. Information Systems Research, 31(4), 1037–1063. →
Barron, G., & Yechiam, E. (2002). Private e‑mail requests and the diffusion of responsibility. Computers in Human Behavior, 18(5), 507–520. →
Bavdaž, M. (2010a). Sources of measurement errors in business surveys. Journal of Official Statistics, 26(1), 25–42. →
Bavdaž, M. (2010b). The multidimensional integral business survey response model. Survey Methodology, 36(1), 81–93. →
Bischof, J., P. Doerrenberg, D. Rostam-Afschar, D. Simons, & J. Voget(2025). The German Business Panel: Firm-Level Data for Accounting and Taxation Research. European Accounting Review, 34(4), 1499–1527. a, b, c
Bouneffouf, D., & Rish, I. (2019). A survey on practical applications of multi-armed and contextual bandits. CoRR, abs/1904.10040. →
Breur, T. (2016). Statistical power analysis and the contemporary ‘crisis’ in social sciences. Journal of Marketing Analytics, 4(2), 61–65. →
Cialdini, R. B. (2001). The science of persuasion. Scientific American, 284(2), 76–81. →
Cook, C., Heath, F., & Thompson, R. L. (2000). A meta-analysis of response rates in web- or Internet-based surveys. Educational and Psychological Measurement, 60(6), 821–836. →
Couper, M. P. (2008). Designing effective web surveys. New York: Cambridge University Press. →
Crawford, S. D., Couper, M. P., & Lamias, M. J. (2001). Web surveys: perceptions of burden. Social Science Computer Review, 19(2), 146–162. a, b
Daikeler, J., Bošnjak, M., & Lozar Manfreda, K. (2020). Web versus other survey modes: an updated and extended meta-analysis comparing response rates. Journal of Survey Statistics and Methodology, 8(3), 513–539. →
Dillman, D.A. (2007) Mail and internet surveys: the tailored design method: 2007 with new internet, visual and mixed-mode guide. 2nd ed. Wiley, Hoboken. →
Dillman, D. A. (2021). Towards survey response rate theories that no longer pass each other like strangers in the night. In P. S. Brenner (Ed.), Understanding survey methodology: sociological theory and applications (Vol. 4, pp. 15–44). Cham: Springer. →
Du, Y., Cook, J. D., & Lee, J. J. (2018). Comparing three regularization methods to avoid extreme allocation probability in response-adaptive randomization. Journal of Biopharmaceutical Statistics, 28(2), 309–319. a, b
Evans, J. R., & Mathur, A. (2005). The value of online surveys. Internet Research, 15(2), 195–219. →
Fan, W., & Yan, Z. (2010). Factors affecting response rates of the web survey: a systematic review. Computers in Human Behavior, 26(2), 132–139. a, b
Felix, L. M., Burchett, H. E., & Edwards, P. J. (2011). Factorial trial found mixed evidence of effects of pre-notification and pleading on response to Web-based survey. Journal of Clinical Epidemiology, 64(5), 531–536. →
Ferreira, K. J., Simchi-Levi, D., & Wang, H. (2018). Online network revenue management using Thompson sampling. Operations Research, 66(6), 1586–1602. →
Gaul, J. J., Keusch, F., Rostam-Afschar, D., & Simon, T. (2025). Replication data and code: invitation messages for business surveys: a multi-armed bandit experiment (Version 1.0.0). GESIS Datorium. https://doi.org/10.7802/2836. →
Guéguen, N., & Jacob, C. (2002). Solicitation by e‑mail and solicitor’s status: a field study of social influence on the web. Cyber Psychology & Behavior, 5(4), 377–383. →
Hack, L., & Rostam-Afschar, D. (2024). “Understanding Firm Dynamics with Daily Data”, Discussion paper, CRC 224 Economic Perspectives on Societal Challenges Discussion Paper 593 and CRC 266 Accounting for Transparency Working Paper Series No. 155, available at SSRN. https://ssrn.com/abstract=4944988 →
Haraldsen, G. (2018). Response processes and response quality in business surveys. In B. Lorenc, et al. (Ed.), The unit problem and other current topics in business survey methodology (pp. 155–176). Newcastle upon Tyne: Cambridge Scholars Publishing. a, b
Heberlein, T. A., & Baumgartner, R. (1978). Factors affecting response rates to mailed questionnaires: a quantitative analysis of the published literature. American Sociological Review, 43(4), 447–462. →
Heerwegh, D. (2005). Effects of personal salutations in E‑mail invitations to participate in a web survey. Public Opinion Quarterly, 69(4), 588–598. →
Heerwegh, D., & Loosveldt, G. (2002). An evaluation of the effect of response formats on data quality in web surveys. Social Science Computer Review, 20(4), 471–484. →
Heerwegh, D., & Loosveldt, G. (2006). An experimental study on the effects of personalization, survey length statements, progress indicators, and survey sponsor logos in web surveys. Journal of Official Statistics, 22(2), 191–210. a, b
Heerwegh, D., & Loosveldt, G. (2007). Personalizing E‑mail contacts: its influence on web survey response rate and social desirability response bias. International Journal of Public Opinion Research, 19(2), 258–268. →
Heerwegh, D., Vanhove, T., Matthijs, K., & Loosveldt, G. (2005). The effect of personalization on response rates and data quality in web surveys. International Journal of Social Research Methodology, 8(2), 85–99. →
Hill, D. H., & Willis, R. J. (2001). Reducing panel attrition: a search for effective policy instruments. Journal of Human Resources, 36(3), 416–438. a, b
Hoffmann, M., Picard, B., Marie, C., & Bied, G. (2023). “An adaptive experiment to boost Online skill signaling and visibility”, Working paper. https://bertillepicard.github.io/documents/papers/AnAdaptiveExpeToBoostOnlineSkillsSignaling.pdf (10-04-2024) a, b
Hui, K.-L., Teo, H. H., & Lee, S.-Y. T. (2007). The value of privacy assurance: an exploratory field experiment. MIS Quarterly, 31(1), 19–33. →
Joinson, A. N., & Reips, U.-D. (2007). Personalized salutation, power of sender and response rates to Web-based surveys. Computers in Human Behavior, 23(3), 1372–1383. →
Kaibel, C., & Biemann, T. (2021). Rethinking the gold standard with multi-armed bandits: machine learning allocation algorithms for experiments. Organizational Research Methods, 24(1), 78–103. a, b, c, d
Kandasamy, K., Krishnamurthy, A., Schneider, J., & Poczos, B. (2018). Parallelised Bayesian optimisation via Thompson sampling. In A. Storkey & F. Perez-Cruz (Eds.), Proceedings of the twenty-first international conference on artificial intelligence and statistics. PMLR. Proceedings of machine learning research, (Vol. 84, pp. 133–142). →
Kaplowitz, M. D., Lupi, F., Couper, M. P., & Thorp, L. (2012). The effect of invitation design on web survey response rates. Social Science Computer Review, 30(3), 339–349. a, b, c, d, e, f, g
Kasy, M., & Sautmann, A. (2021). Adaptive treatment assignment in experiments for policy choice. Econometrica, 89(1), 113–132. →
Kemper, J., & Rostam-Afschar, D. (2024). Earning while learning: how to run batched bandit experiments. http://rostam-afschar.de/KRA2025/bbandits.pdf a, b, c, d
Kent, R., & Brandal, H. (2003). Improving Email response in a permission marketing context. International Journal of Market Research, 45(4), 1–13. →
Keusch, F. (2015). Why do people participate in web surveys? Applying survey participation theory to Internet survey data collection. Management Review Quarterly, 65(3), 183–216. a, b, c, d
König, C., & Sakshaug, J. W. (2023). Nonresponse trends in establishment panel surveys: findings from the 2001–2017 IAB establishment panel. Journal for Labour Market Research, 57(23). →
König, C., Sakshaug, J. W., Stegmaier, J., & Kohaut, S. (2021). Trends in establishment survey nonresponse rates and nonresponse bias: evidence from the 2001–2017 IAB establishment panel. Journal of Official Statistics, 37(4), 931–953. →
Küfner, B., Sakshaug, J. W., & Zins, S. (2022). Analysing establishment survey non-response using administrative data and machine learning. Journal of the Royal Statistical Society Series A: Statistics in Society, 185(Supplement 2), S310–S342. →
Langeland, J., et al. (2023). Recent findings from experiments in establishment surveys. In G. Snijkers, et al. (Ed.), Advances in business statistics, methods and data collection (pp. 437–467). Hoboken: Wiley. a, b, c
Liu, Y., Van Roy, B., & Xu, K. (2023). Nonstationary bandit learning via predictive sampling. In F. Ruiz, J. Dy & J.-W. van de Meent (Eds.), International Conference on Artificial Intelligence and Statistics (Vol. 206, pp. 6215–6244). →
Manfreda, K. L., Bošnjak, M., Berzelak, J., Haas, I., & Vehovar, V. (2008). Web surveys versus other survey modes: a meta-analysis comparing response rates. International Journal of Market Research, 50(1), 79–104. →
Muñoz-Leiva, F., Sánchez-Fernández, J., Montoro-Ríos, F., & Ibáñez-Zapata, J. Á. (2010). Improving the response rate and quality in Web-based surveys through the personalization and frequency of reminder mailings. Quality & Quantity, 44, 1037–1052. →
Petrovčič, A., Petrič, G., & Manfreda, K. L. (2016). The effect of email invitation elements on response rate in a web survey within an online community. Computers in Human Behavior, 56, 320–329. a, b
Pielsticker, D. I., & Hiebl, M. R. (2020). Survey response rates in family business research. European Management Review, 17(1), 327–346. →
Porter, S. R., & Whitcomb, M. E. (2003). The impact of contact type on web survey response rates. The Public Opinion Quarterly, 67(4), 579–588. a, b, c
Ramirez, C., (1997). Effects of precontacting on response and cost in self-administered establishment surveys, proceedings of the Survey Research Methods Section, Joint Statistical Meetings, Anaheim, CA, Aug. 10–14, American Statistical Association, Alexandria, VA, pp. 1000–1005. →
Sánchez-Fernández, J., Muñoz-Leiva, F., & Montoro-Ríos, F. J. (2012). Improving retention rate and response quality in Web-based surveys. Computers in Human Behavior, 28(2), 507–514. →
Sauermann, H., & Roach, M. (2013). Increasing web survey response rates in innovation research: an experimental study of static and dynamic contact design features. Research Policy, 42(1), 273–286. →
Sax, L. J., Gilmartin, S. K., & Bryant, A. N. (2003). Assessing response rates and Nonresponse bias in web and paper surveys. Research in Higher Education, 44(4), 409–432. →
Schwartz, E. M., Bradlow, E. T., & Fader, P. S. (2017). Customer acquisition via display advertising using multi-armed bandit experiments. Marketing Science, 36(4), 500–522. →
Scott, S. L. (2010). A modern Bayesian look at the multi-armed bandit. Applied Stochastic Models in Business and Industry, 26(6), 639–658. a, b, c, d, e, f
Snijkers, G., Haraldsen, G., Jones, J., & Willimack, D. (2013). Designing and conducting business surveys. Hoboken: John Wiley & Sons. a, b, c, d, e, f, g, h, i
Tanis, M. (2007). Online social support groups. In A. Joinson, K. McKenna, T. Postmes & U. Reips (Eds.), The Oxford handbook of Internet psychology (pp. 139–153). New York: Oxford University Press. →
Thompson, W. R. (1933). On the likelihood that one unknown probability exceeds another in view of the evidence of two samples. Biometrika, 25(3-4), 285–294. →
Tomaskovic-Devey, D., Leiter, J., & Thompson, S. (1994). Organizational survey nonresponse. Administrative Science Quarterly, 39(3), 439–457. →
Torres van Grinsven, V., Bolko, I., & Bavdaž, M. (2014). In search of motivation for the business survey response task. Journal of Official Statistics, 30(4), 579–606. →
Trespalacios, J. H., & Perkins, R. A. (2016). Effects of personalization and invitation Email length on web-based survey response rates. TechTrends, 60, 330–335. a, b
Trouteaud, A. R. (2004). How you ask counts: a test of Internet-related components of response rates to a web-based survey. Social Science Computer Review, 22(3), 385–392. →
Wiley, J. B., Han, V., Albaum, G., & Thirkell, P. (2009). Selecting techniques for use in an Internet survey. Asia Pacific Journal of Marketing and Logistics, 21(4), 455–474. →
Willimack, D. K., & Nichols, E. (2010). A hybrid response process model for business surveys. Journal of Official Statistics, 26(1), 3–24. →
Yammarino, F. J., Skinner, S. J., & Childers, T. L. (1991). Understanding mail survey response behavior a meta-analysis. Public Opinion Quarterly, 55(4), 613–639. →
Zhang, K., Janson, L., & Murphy, S. (2020). Inference for batched bandits. In H. Larochelle, M. Ranzato, R. Hadsell, M. Balcan & H. Lin (Eds.), Advances in neural information processing systems (Vol. 33, pp. 9818–9829). Curran Associates. a, b, c