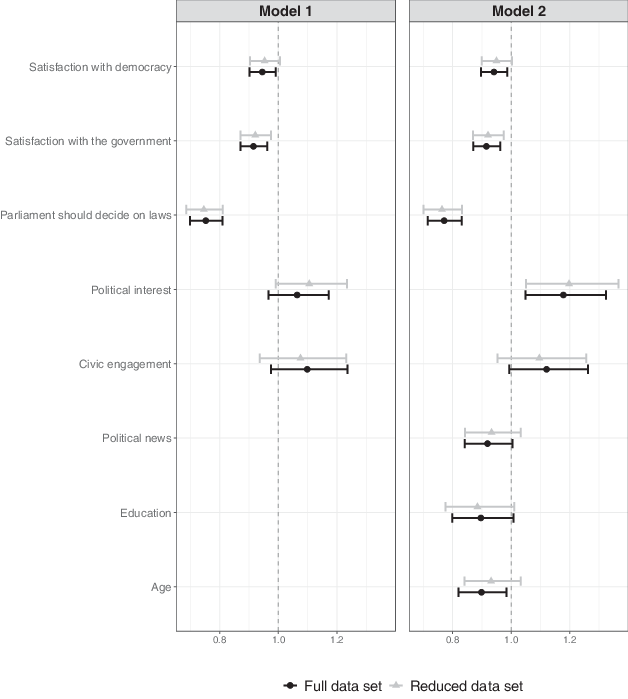
Fig. 1 Comparison of odds ratios and 95% confidence intervals from logistic regression models: Full data set versus reduced data without internet users in the mail mode, Gherghina and Geissel (2019).
The online version of this article (https://doi.org/10.18148/srm/2026.v20i2.8351) contains supplementary material.
In recent years, several probability-based online panels have been established in the social sciences (Blom et al. 2015; Callegaro et al. 2014; Das et al. 2018; Weiß et al. 2020). These panel studies repeatedly send out online questionnaires for collecting data from a pool of members recruited with probability-based sampling methods. This way, online panels aim to obtain unbiased population estimates based on cost-efficient, accurate and timely measurements from web surveys (Callegaro and Disogra 2008; Couper 2008; Greenlaw and Brown-Welty 2009; Kreuter et al. 2008). However, as with all surveys of the general population, the data quality of online panels is threatened by potential errors of nonobservation, such as coverage and nonresponse bias (Couper et al. 2007). While coverage bias in online surveys—such as the exclusion of non-internet users or other obstacles to participation—has been extensively studied (Bethlehem 2010; Eckman 2016; Sterrett et al. 2017; Toepoel and Hendriks 2016), the implications of nonresponse bias have received comparatively less attention. Concerning sample means, nonresponse bias occurs if eligible panel members refuse to participate and those refusals differ from participating panelists in target variables (Groves et al. 2013).
One strategy for online panels to deal with coverage and nonresponse bias is to implement a mixed-mode design where sampled persons are offered additional modes of responding (de Leeuw 2005; de Leeuw 2018; Dillman et al. 2014). Studies show that providing people without internet access the opportunity to participate in alternative survey modes reduces coverage bias of population estimates (Bosnjak et al. 2018; Cornesse et al. 2022; Cornesse and Schaurer 2021; Pforr and Dannwolf 2017; Rookey et al. 2008). This is due to the fact that non-internet users differ from individuals using the internet in key characteristics such as demographics (Blom et al. 2017; Eckman 2016; Herzing and Blom 2019), behavior (Zhang et al. 2009), attitudes (Robinson et al. 2002), and health (Schnell et al. 2017). However, little is known about whether offering an alternative mode to internet users who are unwilling to participate online reduces nonresponse bias. Allowing such internet users to complete mail, phone, or face-to-face interviews can increase the recruitment rate if these individuals would not otherwise become panel members. Additionally, it may reduce nonresponse bias if internet users unwilling to be surveyed online (hereafter also referred to as “unwilling onliners”) differ from the remaining sample in the variables of interest (Felderer and Herzing 2023).
Several factors may explain why internet users who prefer mail surveys differ from those who respond online (Bretschi and Weiß 2022). Privacy concerns about providing personal data in digital formats can discourage online participation among some internet users. Additionally, differences in digital literacy or patterns of internet use may influence individuals’ willingness to engage in web surveys, with less confident or infrequent users opting for mail. Finally, survey motivation itself may play a role; individuals willing to respond via mail despite the availability of online participation may exhibit higher levels of intrinsic motivation to participate, even if they are hesitant to use the web. Because these factors might be associated with demographic and socioeconomic characteristics such as age, education, and income, excluding unwilling onliners may introduce nonresponse bias and may therefore affect survey estimates.
On the other hand, recruiting internet users in an offline survey mode can substantially increase survey costs because a lower proportion of panelists will participate in inexpensive web surveys. The mode of participation is particularly consequential for panel studies with frequent data collections, where the mode cost of each member accumulates across waves. Thus, an important question in establishing or refreshing online panels using a mixed-mode recruitment strategy is whether the investment of offering internet users the opportunity to participate in an offline survey mode pays off in terms of improved data quality.
This study uses data from the GESIS Panel, a German probability-based mixed-mode panel that combines web and mail surveys, to address the research question of whether recruiting internet users in the mail mode reduces nonresponse bias. Different nonresponse bias analyses assess the impact of including such unwilling onliners in the sample on population and model estimates. To investigate the overall question, this paper is organized into three specific research questions:
Do internet users recruited in the mail mode have different characteristics than non-internet users in the mail mode or internet users in the web mode?
How does the inclusion of internet users in the mail mode affect population estimates?
How does the inclusion of internet users in the mail mode affect estimates of multivariate models?
Next to providing equipment to individuals without internet access, a common strategy to include the offline population in a sample of a probability-based online panel is to implement a mixed-mode design (Blom et al. 2015). Previous studies show that both recruitment strategies improve the accuracy of estimating demographic parameters such as age, gender, household size, and education (Blom et al. 2017; Bosnjak et al. 2018; Leenheer and Scherpenzeel 2013; Revilla et al. 2015), or substantial variables such as political interest (Toepoel and Hendriks 2016), the election outcome (Rookey et al. 2008), and other variables relevant for political science research (Pforr and Dannwolf 2017). However, after including the offline population as panel members, several studies still find deviations in estimates of population characteristics between probability-based online and mixed-mode panels and benchmark data (Blom et al. 2017; Bosnjak et al. 2018; Struminskaya et al. 2014). These findings suggest an existing nonresponse bias that can arise at different levels of the panel process, such as in the typically used multi-step recruitment approach or at the wave or item level (Callegaro and Disogra 2008; Hoogendoorn and Daalmans 2009; Schaurer 2017). After the panel recruitment phase, studies consistently indicate that nonresponse bias leads to an underrepresentation of persons with low education, one-person households, and non-citizenship (Cornesse and Schaurer 2021; Leenheer and Scherpenzeel 2013; Revilla et al. 2015).
Little is known yet about whether nonresponse bias of probability-based online panels is potentially driven by internet users who refuse to participate via the web mode. It is also unclear whether a mixed-mode approach can reduce such a bias by providing internet users an alternative mode of data collection. Several probability-based online panels extended to a mixed-mode design allow individuals with internet access to respond in the mail or telephone mode, such as the GESIS Panel in Germany (Bosnjak et al. 2018), the Life in Australia study in Australia (Kaczmirek et al. 2019), the NatCen panel in the U.K. (Jessop 2017), or the Gallup panel (Rookey et al. 2008) and the AmeriSpeak panel (Dennis 2019) both in the U.S. But few panels provide information on how many participants who use the internet privately do not participate via the web mode. For example, nearly 10% of the members who agreed to register for the Gallup panel explicitly asked to receive questionnaires by mail although they provided an email address (Rookey et al. 2008). The NatCen panel applies a sequential mixed-mode design, where panelists are first invited by multiple contacts to participate online before being asked by telephone if they had not yet responded after two weeks (Jessop 2017). This web-first approach resulted in between two and five percent of individuals with internet access participating via the telephone mode. In the first cohort of the GESIS Panel, over 20% of the internet users declined to respond by the web mode and choose the mail mode instead (Bosnjak et al. 2018; Pforr and Dannwolf 2017). First indications of the effect from including internet users in the mail mode on sample accuracy is provided by Cornesse and Schaurer (2021) and Bach et al. (2023). Cornesse and Schaurer (2021) compared the sample accuracy of the full GESIS Panel sample from the first cohort with two versions of reduced data sets that 1) removed only non-internet users from the mail mode and 2) removed all members of the mail mode, including the unwilling onliners. The results suggest that including internet users in the mail mode reduces the bias aggregated across a set of demographic variables more than offering the mail mode to non-internet users only. On the other hand, Bach et al. (2023) found that including respondents which were equipped with internet access and devices specifically for the GIP panel study, does not impact the results of multivariate model estimates. However, these results might still suffer from nonresponse bias, as among individuals without internet access, those willing to be equipped likely represent a relatively small and distinct group. These individuals may differ systematically from those who neither have nor want internet access, potentially introducing selection effects.
The present study extends the analysis of Cornesse and Schaurer (2021) by focusing on how offering unwilling onliners a mail mode option affects the nonresponse bias in estimates of population means and multivariate models. To this end, we will investigate the research questions of this study in three analysis steps and using data of the GESIS Panel, both of which are described in the next section.
This study is based on data from the GESIS Panel, a German probability-based mixed-mode panel operated by GESIS—Leibniz Institute for the Social Sciences (GESIS 2020). In December 2018, the panel consisted of 5762 members from an initial cohort sampled in 2013 and two refreshment cohorts sampled in 2016 and 2018. The target population is German-speaking individuals aged 18 years and older (for the initial cohort between 18 and 70 years) that permanently reside in private households in Germany. The sampling strategy is based on a two-stage probability sampling procedure in which individuals are selected from population registers of randomly drawn municipalities. Panel members from 2016 and 2018 were recruited by applying a piggy-backing approach with the German General Social Survey (ALLBUS) as a vehicle for the recruitment. A piggy-backing approach can be used as a cost-efficient method to recruit panel members while they are being interviewed for a well-established survey. The ALLBUS is a cross-sectional face-to-face survey on attitudes, behavior, and social structure in Germany conducted every two years (Terwey 2000). Detailed information about the GESIS Panel sampling and recruitment procedure can be found at Bosnjak et al. (2018), and for the three cohorts at Schaurer et al. (2014); Schaurer and Weyandt (2016), and Schaurer et al. (2020).
The data collection of the GESIS Panel is administered in two modes, namely in web-based surveys (web mode) and paper-and-pencil surveys sent via postal mail (mail mode). The mode assignment takes place in a multi-step recruitment procedure that encompasses an interviewer-administered recruitment interview and a self-administered profile survey. At the end of the recruitment interview, the web mode is presented to internet-using respondents as the default option for participation. This is done to increase the proportion of panel members who participate online. Respondents are classified as internet users if they indicate that they use the internet for private purposes at the time of the recruitment rarely, at least. This classification was measured on a binary scale. If these internet users are not willing to participate in the web mode, they are allowed to opt for the mail mode. In the following, this mode group is called “internet users in the mail mode” or “unwilling onliners”. Participants who do not use the internet at the time of panel recruitment are automatically assigned to the mail mode without having a choice. Individuals of this mode group are called “non-internet users in the mail mode”, even though many of them reported using the internet after the recruitment. For the following analysis, affiliation to a mode group refers to the status of the recruitment, which is decisive for the group assignment. This status remains unchanged, regardless of whether respondents later use or do not use the internet or switched to web mode.1 Among all internet users from the three GESIS Panel cohorts, 28% refused to participate in the web mode during the recruitment procedure and choose the mail mode instead. Thus, in relation to all panel members, 24% of participants were internet users in the mail mode right after the recruitment. This recruitment strategy of the GESIS Panel has consequences for survey costs since for each wave, the variable costs of panelists responding via the mail mode are around three times higher than a panel member responding via the web mode (Bretschi et al. 2023).
The survey waves of the GESIS Panel have taken place every other month, with each taking about 20 min. Every panel member, independently of participation mode, receives a survey invitation sent by mail, including a prepaid cash incentive of € 5. Web mode panelists are sent an additional email invitation and those who have not answered the survey after one or two weeks receive up to two email reminders. Participants of the mail mode do not receive any reminders due to the cost of sending letters by mail.
In accordance with the three research questions of this paper, we have structured the analysis in three steps. To address research question one, we explore whether internet users in the mail mode differ from non-internet users in the mail mode and internet users in the web mode. All mode groups are compared for differences in estimates of demographic characteristics, internet usage after the recruitment, and political interest. The demographic variables include age, gender, education, legal marital status, household size, and immigration background (defined in terms of German citizenship). The analysis is based on data from all panelists who were invited to the December/January wave 2018/2019 because the demographic characteristics were measured in this survey, and it is the first wave where all newly recruited panelists from the cohort 2018 are included. Table 1 shows the active panel members invited to the December/January wave 2018/2019 by mode groups and cohorts. Across all cohorts, 89% of the invited panelists fully or partially completed the survey. Missing values in the demographic characteristics were imputed with data from previous GESIS Panel waves where possible. Internet usage after the recruitment was measured in the October/November wave 2018 and political interest in the April/May wave 2019. To test whether unwilling onliners differ statistically from other mode groups, we conducted two-tailed z-tests for each category (Abebe 2019) and adjusted for multiple comparisons using the Bonferroni-Holm correction method (Holm 1979). The estimates and statistical tests take into account weighting factors which are required due to different inclusion probabilities of respondents from different cohorts (Kolb et al. 2020). To assess selection effects due to panel attrition, we present additional analyses of differences between mode groups for each recruitment cohort separately in the Appendix.
Table 1 GESIS Panel members by mode groups and cohorts for panelists invited to the December/January 2018/2019 wave
Cohort 2013 | Cohort 2016 | Cohort 2018 | Total | |||||
% | n | % | n | % | n | % | n | |
Mode groups and internet usage refer to the time of the panel recruitment. Non-internet users who were assigned to the mail mode during the recruitment retain this status regardless of whether they became internet users afterwards. The numbers refer to active GESIS panel members invited to the December/January wave 2018/2019 by mode groups and cohorts. | ||||||||
Web mode | 68 | 1999 | 66 | 817 | 66 | 1043 | 67 | 3859 |
– | – | – | – | – | – | – | – | |
Mail mode: Internet users | 21 | 601 | 22 | 278 | 22 | 351 | 21 | 1230 |
Mail mode: Non-internet users. | 11 | 333 | 12 | 145 | 12 | 183 | 12 | 661 |
Total | 100 | 2933 | 100 | 1240 | 100 | 1577 | 100 | 5750 |
No. of waves | 31 | 13 | 2 | – | ||||
Calc. attrition rate (%) | 40 | 27 | 2 | – | ||||
To answer research question two, we evaluate potential nonresponse bias in univariate population estimates by assuming that internet users were not offered the option of participating in the mail mode, that is, as if the GESIS Panel were composed only of panelists from the web mode and from non-internet users in the mail mode. For the same variables and data described above, we compare population estimates based on the full GESIS Panel data set with a reduced data set that excludes unwilling onliners. Additionally, estimations of both data sets are compared to estimates based on the full ALLBUS data from 2018 as a reference sample. The ALLBUS qualifies as benchmark data for two reasons. First, the ALLBUS is considered a high-quality face-to-face survey based on a large scale probability-based sample of the same general population. Such a survey design has long been seen as the gold standard in survey methods (De Leeuw and Hox 2014; Schober 2018). Second, the ALLBUS served as a vehicle for recruiting the GESIS Panel cohorts from 2016 and 2018. The recruitment interview for the GESIS Panel takes place at the end of the ALLBUS interview and is not announced to respondents beforehand. Therefore, ALLBUS estimates are not affected by the mode assignment and potential biases in the GESIS Panel data that could result from subsequent recruitment steps. All estimates are weighted using design weights to account for unequal selection probabilities. To assess statistical differences between the GESIS Panel samples, we used a two-tailed paired z-test for each category to account for dependency of both samples, again using the Bonferroni-Holm correction method to adjust for multiple comparisons. Estimates based on both GESIS Panel data and ALLBUS data were compared using two-tailed z-tests and also subsequently adjusted with the Bonferroni-Holm method. Statistically significant differences between estimates indicate whether including unwilling onliners influences nonresponse bias. The GESIS Panel cohort from 2013 was restricted to individuals aged up to 70 while the other cohorts did not employ this restriction. For this reason, we additionally present estimates for all three data sets with an age range between 18 and 70 in the Appendix.
To address research question three, we use a different method to investigate how the inclusion of internet users in the mail mode affects both means and model estimates of multivariate analyses. For this purpose, we have reproduced three studies published with data of the GESIS Panel with a full data set and a data set from which unwilling onliners are excluded in order to explore whether the conclusions from previous studies would change substantially. Again, comparing the results from both analyses allows an estimation of the counterfactual situation in which internet users were not recruited in the mail mode. The methods used for this third analysis step have been adopted from Eckman, who used this approach to investigate coverage bias using survey paradata (Eckmann 2013) and including the offline population in the LISS panel (Eckman 2016).
The three reproduced studies are Gherghina and Geissel (2019); Heinisch and Wegscheider (2020) and Bischoff and Kusa (2019), from the fields of political and economic sciences, which are two of the most frequently used research areas for GESIS Panel data (https://www.gesis.org/gesis-panel/gesis-panel-home/bibliography). For the selection of the articles, we were guided by four criteria similar to those proposed by Eckman (2016).2 Table 2 provides an overview of the three studies. While Heinisch and Wegscheider (2020) could provide the analysis code, this was not the case for the study of Gherghina and Geissel (2019). For this reason, we used summary statistics to reproduce the analysis. We could not reproduce identically the exact numbers of two control variables (age and education) used by Gherghina and Geissel (2019). In addition, five cases were removed from the analyses of Heinisch and Wegscheider (2020) and twelve cases from the analysis of Gherghina and Geissel (2019) due to missing values in the variable which defines the recruitment mode. Bischoff and Kusa (2019) could provide the analysis code which we adapted into our R script. However, 62 cases had to be removed from the analysis due to missing values. In all reproduced studies, these minor discrepancies do not substantially change the results based on the full GESIS Panel data set (for details see Tables 6 to 14 in the Appendix). We, therefore, assume that the research objective of comparing estimates between a full and reduced data set is not affected. All studies use data only from the first cohort recruited in 2013, as no eligible studies could be found that additionally used data from the other two cohorts.
Table 2 Reproduced studies
Study | Journal | Citations in Google Scholara |
Data from the following waves were used by Heinisch and Wegscheider (2020): cb (2015), cc, cd, cf, db, dc, df, eb, ee, ef (2018); Gherghina and Geissel (2019): bd (2014); Bischoff and Kusa (2019): ba (2014), bb, bd, bf, ca (2015). The wave names refer to the GESIS Panel naming convention (GESIS 2020). aAs of February 10, 2025. | ||
Heinisch, R., & Wegscheider, C. (2020). Disentangling how populism and radical host ideologies shape citizens’ conceptions of democratic decision-making | Politics and Governance | 55 |
Gherghina, S., & Geissel, B. (2019). An alternative to representation: Explaining preferences for citizens as political decision-makers | Political Studies Review | 58 |
Bischoff, I., & Kusa, N. (2019). Should wealth transfers be taxed? Evidence from a representative German survey | Public Finance Review | 7 |
Following Eckman (2016), we present means and model estimates for each of the three reproduced studies. The analysis begins with estimating the nonresponse bias and the absolute relative nonresponse bias in the population means as univariate estimates for all independent and dependent variables3 used in the models of the studies. To assess nonresponse bias, we assume that population means are estimated based on the full GESIS Panel data set, defined as . Means estimated using the reduced GESIS Panel data set without unwilling onliners is specified as . Nonresponse bias is then defined as the difference between the first and the second mean:
We perform linear regression models for each variable that is included in the reproduced models to test whether the nonresponse bias estimated in Eq. 1 is significantly different from zero. The dependent variable of these regression models is the variable of interest, and the sole independent variable is a binary indicator that flags cases of unwilling onliners. A significant coefficient indicates that the means between the cases of unwilling onliners and the cases of the remaining sample are different, and nonresponse bias in the mean is significant. However, since the model variables have different units, it is difficult to compare a bias across these items. For this reason, Eckman (2016) suggests as an additional analysis the estimation of the absolute relative bias, which in this context is:
There are no significance tests for the absolute relative bias because it is a ratio of two estimated quantities. A Hotelling test is used to explore whether the cases of unwilling onliners and the cases of the remaining sample differed in the means across all the model variables of each reproduced study.
In addition to assessing biases in the means, we investigate how the exclusion of unwilling online respondents affects multivariate analyses. To this end, we present point estimates and confidence intervals of the reproduced regression models of all studies again based on GESIS Panel data with and without including the internet users in the mail mode. For this, we reproduce the model with the most control variables in each of the three studies. To assess the effect of removing cases from the analysis, an overlap measure is used that was developed by Karr et al. (2006). This overlap measure offers a quantitative indicator of the model agreement at the coefficient level. The measure calculates a range between 0% and 100% reflecting the match of the two confidence intervals. A high percentage expresses that the models based on the reduced and the full data set agree, and thus the model estimates are less affected by the removal of internet users in the mail mode.
Finally, we use logistic regression models to evaluate how well the models’ independent variables can predict the indicator that identified unwilling onliners. This is due to the fact that nonresponse bias is less of a risk if a model includes variables that predict unwilling onliners. Therefore, the area under the receiver operating characteristic (ROC) curve can be used to show the models’ ability to discriminate between cases of internet users in the mail mode and the combined cases of the other mode groups, where a higher percentage indicates better discrimination. All statistical analyses are performed using R version 4.4.2 (R Core Team 2024).
Table 3 presents differences in characteristics between internet users recruited in the mail mode on the one hand and non-internet users assigned to the mail mode and panelists of the web mode on the other hand. The table includes all active panel members of the GESIS Panel who were invited to the December/January wave 2018/2019. The superscript letter A in the fifth and superscript letter B in the eighth columns indicate whether the characteristics of unwilling onliners differ significantly from panel members of each other mode group. The table also present statistical significant differences in estimates between internet users of the mail mode and panel members using the web mode with the superscript letter C also in the eighth column. The results show that unwilling onliners vary significantly from both other mode groups in many demographic characteristics such as age groups, education, individuals with a marital status single or widowed, as well as households with singles and three or more members. No significant differences between internet users in the mail mode and the other two mode groups only exist for the demographic characteristics of married/registered partners living apart or living together, two household members, and persons without German citizenship. Less surprisingly, substantial differences between the mode groups can be found for nearly all categories of internet usage measured in the October/November wave 2018. The table illustrates that nearly 33% of the non-internet users who were assigned to the mail mode during the panel recruitment indicated using the internet at least rarely at that time, which summarizes all four response categories from “rarely/once a month or less” to “daily”. Concerning political interest, the results are quite similar across the three groups except for those whose interest is very strong. The outcomes are largely the same when variables are compared separately for the three GESIS Panel cohorts indicating a similar selection process for each recruitment (see Appendix Tables 15 to 17). The characteristics of panelists invited to the December/January wave do not appear to be substantially affected by a differential panel attrition.
Table 3 Comparison of estimates of the proportions of demographic characteristics, internet usage, and political interest between GESIS Panel mode groups
Mail mode—internet users | Mail mode—non-internet users | Web mode | |||||||
95% C.I. | 95% C.I. | 95% C.I. | |||||||
% | Lower | Upper | % | Lower | Upper | % | Lower | Upper | |
GESIS Panel data sets are based on 5750 panelists from three cohorts invited to the December/January wave 2018/2019 Estimates are weighted using the GESIS Panel’s design weights for the complex sample survey Tests were adjusted for multiple comparisons using the Bonferroni-Holm correction method (Holm 1979) a RP = “Registered partnership” A p<0.05 (Mail mode, internet users vs. non-internet users) B p<0.05 (Internet users mail mode vs. panelists web mode) C p<0.05 (Non-internet users mail mode vs. panelists web mode) | |||||||||
Age groups | |||||||||
Age 30 and below | 10 | 8 | 12 | 3A | 2 | 5 | 19BC | 17 | 20 |
Age 31–45 | 14 | 12 | 16 | 3A | 2 | 4 | 24BC | 22 | 25 |
Age 46–60 | 36 | 34 | 39 | 20A | 17 | 23 | 34C | 32 | 35 |
Age 60 and above | 40 | 37 | 43 | 74A | 71 | 78 | 24BC | 22 | 25 |
Gender | |||||||||
Female | 57 | 54 | 60 | 54 | 50 | 58 | 48BC | 47 | 50 |
Education | |||||||||
Low | 24 | 21 | 26 | 58A | 54 | 62 | 11BC | 10 | 12 |
Medium | 39 | 37 | 42 | 28A | 24 | 32 | 29B | 28 | 31 |
High | 37 | 34 | 40 | 14A | 11 | 17 | 59BC | 58 | 61 |
Marital status | |||||||||
Single | 16 | 14 | 18 | 9A | 7 | 11 | 27BC | 26 | 29 |
Married/RPa, living together | 65 | 62 | 68 | 59 | 55 | 64 | 60 | 58 | 62 |
Married/RP, living apart | 2 | 2 | 3 | 3 | 1 | 4 | 2 | 1 | 2 |
Divorced/RP, annulled | 10 | 8 | 12 | 13 | 10 | 15 | 8BC | 7 | 8 |
Widowed/RP died | 7 | 5 | 8 | 17A | 13 | 20 | 4BC | 3 | 4 |
Household size | |||||||||
Single household | 36 | 33 | 39 | 57A | 52 | 61 | 18BC | 16 | 19 |
Two household members | 40 | 36 | 43 | 34 | 30 | 39 | 42C | 41 | 44 |
Three and more hh members | 24 | 22 | 27 | 9A | 6 | 11 | 40BC | 38 | 42 |
Citizenship | |||||||||
No German citizenship | 3 | 2 | 3 | 2 | 1 | 2 | 3C | 3 | 4 |
Private internet usage | |||||||||
Daily | 55 | 52 | 58 | 11A | 9 | 14 | 86BC | 84 | 87 |
More than once a week | 26 | 24 | 29 | 11A | 8 | 13 | 12B | 11 | 13 |
Once a week | 8 | 7 | 10 | 3A | 2 | 4 | 2BC | 1 | 2 |
Rare/once a month or less | 6 | 5 | 7 | 8 | 6 | 11 | 1BC | 0 | 1 |
Never | 5 | 3 | 6 | 67A | 63 | 71 | 0BC | 0 | 0 |
Political interest | |||||||||
Very strong | 5 | 4 | 7 | 9A | 6 | 12 | 8B | 7 | 9 |
Strong | 27 | 24 | 29 | 27 | 22 | 31 | 29 | 27 | 30 |
Moderately | 50 | 47 | 53 | 47 | 42 | 51 | 46 | 44 | 47 |
Little | 15 | 13 | 18 | 14 | 11 | 17 | 14 | 13 | 15 |
Not at all | 3 | 2 | 4 | 3 | 2 | 5 | 3 | 3 | 4 |
n | 1230 | 661 | 3859 | ||||||
As can be seen from Table 3, the values of the unwilling onliners fall somewhat between the values of the other two mode groups for many categories of the demographic characteristics and internet usage. Therefore, it is plausible to assume that although internet users in the mail mode are different in many characteristics from the remaining sample, their exclusion might have only a small effect on the estimation of population means and thus on a potential nonresponse bias of corresponding statistics. The next analysis step will evaluate this assumption by comparing point estimates of the same characteristics based on GESIS Panel data with and without the unwilling onliners and ALLBUS data.
Table 4 provides estimates for all variables from the analysis above separately for a full GESIS Panel data set and a reduced data set without internet users in the mail mode. Significant differences between the two GESIS Panel data sets are marked with the superscript letter A in the estimates of the full data set (fifth column). The comparison of the results shows significant differences only in a few demographic categories. Such differences were found for estimates of persons with high education and those living in households with a single member. Additionally, both data sets differ significantly with respect to every category of internet usage, but in none of the estimates of political interest.
Table 4 Comparison of estimates of proportions between a reduced GESIS Panel data set without unwilling onliners, a full GESIS Panel data set and a benchmark survey
GESIS Panel (reduced data set) | GESIS Panel (full data set) | ALLBUS 2018 | |||||||
95% C.I. | 95% C.I. | 95% C.I. | |||||||
% | Lower | Upper | % | Lower | Upper | % | Lower | Upper | |
The significance level was set at less than 0.05 for all tests The complete GESIS Panel data are based on 5750 panelists and the reduced GESIS Panel data on 4520, both from three cohorts invited to the December/January wave 2018/2019 (see Table 1). The ALLBUS data set 2018 is based on 3477 respondents Estimates are weighted using the GESIS Panel’s design weights for the complex sample survey Tests were adjusted for multiple comparisons using the Bonferroni-Holm correction method (Holm 1979) a RP = “Registered partnership” A p<0.5 (reduced GESIS Panel without internet users in the mail mode vs the complete GESIS Panel with all mode groups) B p<0.5 (reduced GESIS Panel vs the ALLBUS) C p<0.5 (complete GESIS Panel data vs the ALLBUS data) | |||||||||
Age groups | |||||||||
Age 30 and below | 16 | 15 | 18 | 15 | 14 | 16 | 16 | 14 | 17 |
Age 31–45 | 20 | 19 | 22 | 19 | 18 | 20 | 22C | 21 | 24 |
Age 46–60 | 32 | 30 | 33 | 33 | 31 | 34 | 30C | 28 | 31 |
Age 60 and above | 32 | 30 | 33 | 33 | 32 | 35 | 32 | 31 | 34 |
Gender | |||||||||
Female | 49 | 48 | 51 | 51 | 49 | 52 | 49 | 47 | 51 |
Education | |||||||||
Low | 18 | 17 | 20 | 19 | 18 | 20 | 27BC | 25 | 28 |
Medium | 29 | 28 | 30 | 31 | 30 | 32 | 32B | 30 | 34 |
High | 53 | 51 | 54 | 50A | 48 | 51 | 42BC | 40 | 43 |
Marital status | |||||||||
Single | 24 | 23 | 26 | 23 | 22 | 24 | 26C | 25 | 28 |
Married/RPa, living together | 60 | 58 | 62 | 61 | 60 | 62 | 56BC | 55 | 58 |
Married/RP, living apart | 2 | 2 | 2 | 2 | 2 | 3 | 2 | 1 | 2 |
Divorced/RP, annulled | 8 | 7 | 9 | 9 | 8 | 9 | 9 | 8 | 10 |
Widowed/RP died | 6 | 5 | 6 | 6 | 5 | 6 | 7 | 6 | 7 |
Household size | |||||||||
Single household | 23 | 22 | 25 | 26A | 25 | 27 | 20BC | 19 | 22 |
Two household members | 42 | 40 | 43 | 41 | 40 | 42 | 37 | 35 | 38 |
Three and more hh members | 36 | 34 | 37 | 33 | 32 | 35 | 43C | 42 | 45 |
Citizenship | |||||||||
No German citizenship | 3 | 2 | 3 | 3 | 2 | 3 | 7BC | 6 | 8 |
Private internet usage | |||||||||
Daily | 74 | 73 | 75 | 70A | 69 | 72 | 70B | 69 | 72 |
More than once a week | 12 | 11 | 13 | 15A | 14 | 16 | 8BC | 7 | 9 |
Once a week | 2 | 1 | 2 | 3A | 3 | 4 | 2C | 2 | 3 |
Rare/once a month or less | 2 | 1 | 2 | 3A | 2 | 3 | 2 | 1 | 2 |
Never | 10 | 9 | 11 | 9A | 8 | 10 | 18BC | 16 | 19 |
Political interest | |||||||||
Very strong | 8 | 8 | 9 | 8 | 7 | 9 | 11BC | 10 | 12 |
Strong | 29 | 27 | 30 | 28 | 27 | 29 | 28 | 26 | 29 |
Moderately | 46 | 44 | 47 | 47 | 45 | 48 | 46 | 43 | 47 |
Little | 14 | 13 | 15 | 14 | 13 | 15 | 12C | 11 | 14 |
Not at all | 3 | 3 | 4 | 3 | 3 | 4 | 3 | 3 | 4 |
n | 4520 | 5750 | 3477 | ||||||
To evaluate how a removal of unwilling onliners would affect a nonresponse bias in the GESIS Panel data, the categories with substantial differences between the data sets are compared to estimates of the ALLBUS, which serves as a reference sample. Significant differences between the reduced data set and the ALLBUS data are indicated by the superscript letter B and between the full data set and the ALLBUS data by the superscript letter C both are presented with at the ALLBUS estimates (eighth column).
Regarding education, the results suggest that nonresponse bias is increased in estimates of the reduced data set. Removing unwilling onliners from the sample could lead to a further overrepresentation of individuals with a high level of education, which would exacerbate an already existing bias in online panels in favor of highly educated members. In contrast, the estimate of single households is closer to the result of the benchmark survey when based on the reduced rather than the full data set. In terms of internet usage, the exclusion of unwilling onliners shows a mixed picture. Daily internet users appear to be overrepresented in the reduced data set, but the estimates are more accurate in the other categories. However, this result should be interpreted with caution since internet usage was measured with different questions and response scales in both surveys and adjusted afterward. Moreover, the estimate of daily internet users based on the reduced data set is closer to the ALLBUS estimate when all samples are restricted to participants aged 70 and below due to the age restriction of the GESIS Panel cohort from 2013 (see Appendix Table 18). In comparison to Table 4, the age-restricted samples also show slightly different results for estimating individuals with a low education level or households with three or more members, where in both cases a smaller bias can be found for the full GESIS Panel data set. For all the other categories, however, restricting the sample regarding age does not lead to substantially different estimates of the characteristics.
Overall, the removal of internet users in the mail mode from the analysis does not seem to affect many estimates of demographic variables or political interest but may increase an already existing bias regarding education. However, significant differences are to be expected in estimating private internet usage. Since analyses in the social sciences are typically more complex than estimating univariate population parameters, the next section assesses nonresponse bias in means and point estimates of multivariate models.
The following section explores the impact of removing internet users in the mail mode from the sample on nonresponse bias in multivariate analyses. We start with a description of the hypotheses and results from each of three reproduced studies that were published using GESIS Panel data. Subsequently, we provide the results of nonresponse bias analysis in means of the model variables, followed by the presentation of figures of the reproduced models with and without internet users who participate in the mail mode.
The article of Gherghina and Geissel (2019) investigates determinants of preferences for citizens as decision-makers. The authors argue that dissatisfaction with the institutions of representative democracy as well as political interest and active engagement in society are two main features that influence preferences for direct democratic decision-making. Three hypotheses are formulated regarding political dissatisfaction and two hypotheses concerning political engagement. To test these hypotheses, the study calculates odds ratios from two logistic regression models, one without and one with control variables. The dependent variable is the preference for citizens as decision-makers coded 1 if such preferences exist and 0 for alternative or inconsistent preferences. The model’s independent variables include satisfaction with democracy, satisfaction with government performance, critique of parliament as the institution authorized to legislate, interest in politics, civic engagement, and consumption of political news, education, and age as controls.
Table 5 provides an overview of nonresponse bias in estimating means of variables used by the three reproduced studies. For study 1, 67% or six of nine variables included in the full model with controls would show significant nonresponse bias in means if unwilling onliners were not included in the mail mode. A detailed list of variables from the three reproduced studies can be found in the Appendix in Table 19. For example, in study 1, bias was found in estimates of the dependent variable and the control variables education and age. The range of the absolute relative bias is between just over 0% and over 4%, but for most variables below 1%. The result of a Hotelling test shows that means differ on the variables used in models. This test indicates that unwilling onliners and the combined cases of the other two mode groups have different characteristics on these variables.
Table 5 Comparison of means in analysis variables
Variables w/sign. nonresponse bias | Absolute relative bias (%) | |||||||
Study | Model | % unwilling web-mode resp. | % | n | Min | Median | Max | Hotelling Test |
* | ||||||||
1 | Full | 24 | 67 | 6 | 0.2 | 0.8 | 4.3 | F(9, 3163) = 65.7* |
2 | Combined | 19 | 64 | 9 | 0.1 | 1.2 | 7.2 | F(14, 1787) = 91.3* |
3 | Full | 25 | 41 | 11 | 0.3 | 1.0 | 9.3 | F(27, 1222) = 84.1* |
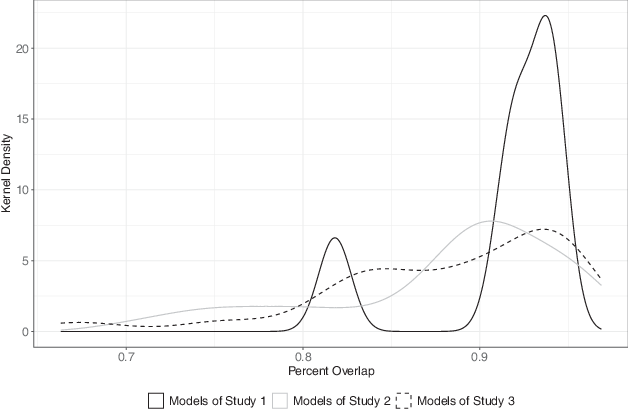
Fig. 1 compares the odds ratios and confidence intervals of the three reproduced models from study 1 estimated with the full and the reduced GESIS Panel data sets (full models are reported in Table 6 and 7 in the Appendix). In both models, the estimates of the two data sets show odds ratios with similar values and largely consistent confidence intervals. Fig. 4 presents an overlap measure of the confidence intervals of the coefficients of all models for each study. The solid line shows that all confidence intervals of study 1 overlap by more than 90%, except two intervals which overlap around 80%. This means that 11 out of a total of 13 confidence intervals overlap by more than 90%, with an overall minimum of 81%, a maximum of 94% and an average of 91% overlap. These results indicate that a removal of unwilling onliners from the data has a rather low impact on the estimates. However, in both models of study 1, the odds ratios for satisfaction with democracy are no longer significant at the 5% level when the model is fitted with the reduced data set, which is also the case for age in Model 2. This is likely due to a loss of statistical power since 24% of the cases were removed from the full data set. While the reduced sample size increases the statistical uncertainty, as evidenced by the wider confidence intervals, the point estimates for the key variable satisfaction with democracy remain nearly identical between the full and reduced datasets (see Fig. 1). The differences are much smaller compared to other variables, such as civic engagement or political interest. Although we conclude that the observed changes are a consequence of the reduced sample size, a main result of the study becomes a null finding as there is no longer sufficient evidence to support Hypothesis 1. Overall, the interpretation of results would likely be the same except for Hypothesis 1, which is tested using the variable ‘satisfaction with democracy’ and may have changed due to failing to reach the conventional significance level.
Fig. 1 Comparison of odds ratios and 95% confidence intervals from logistic regression models: Full data set versus reduced data without internet users in the mail mode, Gherghina and Geissel (2019).
The second reproduced study by Heinisch and Wegscheider (2020) examines how populism and radical host ideologies shape citizens’ conception of democratic decision-making. To investigate this issue, the study is based on data from Germany and Austria. The GESIS Panel data are used to measure four conceptions of democratic decision-making: trusteeship democracy, anti-pluralism, deliberative proceduralism, and majoritarianism. The authors formulate hypotheses about how populist attitudes, radical right attitudes, and radical left attitudes are related to these four conceptions of democracy. The hypotheses are tested in four linear regression models, with the four conceptions of democracy as dependent variables. The main independent variables are attitudes towards populism and radical right and left host ideologies. Attitudes towards right host ideologies are captured by an indicator for right-wing authoritarianism and anti-immigration attitudes. Left host ideologies are measured by an indicator for the left-wing economy. All indicators are measured with one or more additive indices of different Likert items. The models also include several control variables.
The second row of Table 5 presents the results of nonresponse bias in means of the variables used by study 2. Of all fourteen dependent and independent variables, 64% (9) would be affected by significant nonresponse bias in a sample that excluded internet users of the mail mode, which form 19% of the respondents. A bias would exist in two dependent variables (anti-pluralism and trusteeship democracy) as well as in independent variables (e.g., populist attitudes, right-wing authoritarianism) and demographic controls (gender, education, and age). The absolute relative bias ranges between just over 0% and 7%, which was found for education. However, for all variables except education, gender, and age, the absolute relative bias is less than 2%. A significant Hotelling test indicates that unwilling onliners and the remaining sample differ in the variables used in the models of study 2. These results, as also already shown in study 1, indicate that excluding internet users in the mail mode from the analysis sample would introduce nonresponse bias, particularly affecting demographic control variables. While the bias is relatively small for most variables, its presence could still influence the accuracy of model estimates that rely on these controls.
Fig. 2 shows coefficients and confidence intervals between the full and reduced GESIS Panel data sets for the regression models of the article (full models are reported in Tables 8 and 9 in the Appendix). Across all four models, the estimates are fairly close, and the confidence intervals are similar for most coefficients from the reproductions with both data sets. Fig. 4 shows that all confidence intervals overlap more than 70% and for 37 of the 44 coefficients that we see in Fig. 2, the overlap is greater than 80%. Overall, the overlap between the confidence intervals of the full and reduced models’ coefficients ranges from a minimum of 70% to a maximum of 96% with an average of 88%. However, in both Model 1 and Model 2, one non-significant coefficient becomes significant at the 5% level after the removal of unwilling onliners (income and the left-right scale2). In Model 3, on the other hand, the left-right scale is not significant at the 5% level anymore when fitted with the reduced data. These deviations concern control variables, with coefficients and confidence intervals for the main independent variables being largely the same. Therefore, Heinisch and Wegscheider (2020) would likely come to the same conclusions regarding their hypotheses if their analysis were based on a GESIS Panel data set without unwilling onliners.
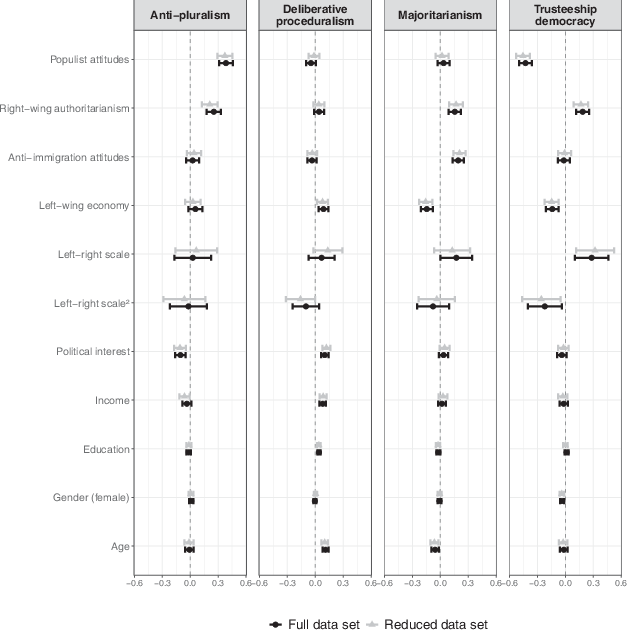
Fig. 2 Comparison of coefficients and 95% confidence intervals from linear regression models: Full data set versus reduced data without internet users in the mail mode, Heinisch and Wegscheider (2020)
The last reproduced study by Bischoff and Kusa (2019) addresses the research question of whether inherited wealth beyond a certain amount should be taxed and identifies factors that predict the opposition to the taxation on inherited wealth. This research question is examined with six hypotheses which address personal and societal interests in the taxation of inheritance. They target rational subjective interests (expectation of own inheritance) but also respondents’ attitudes towards equity principles, societal values and altruism. The binary dependent variable here is whether inheritance should be taxed or not. For the analyses, probit models are used to describe the relationship between the dependent and independent variables.
The third row of Table 5 presents the results of nonresponse bias in means of the variables reported by the authors of study 3 (see Bischoff and Kusa 2019). Of all 26 originally reported independent variables, 41% (11) would be affected by significant nonresponse bias in a sample that excluded internet users of the mail mode, which form almost 25% of the respondents. A detailed list of variables from the reproduced studies can be found in the Appendix Table 19. A bias would exist in eight independent variables (see Fig. 3), meaning that excluding internet users assigned to the mail mode would lead to significant differences in the distribution of these variables compared to the full sample. The absolute relative bias ranges between just over 0% and 9%, but for most variables around 1%. A significant Hotelling test indicates that unwilling onliners and the remaining sample differ in the variables used in the models of study 3.
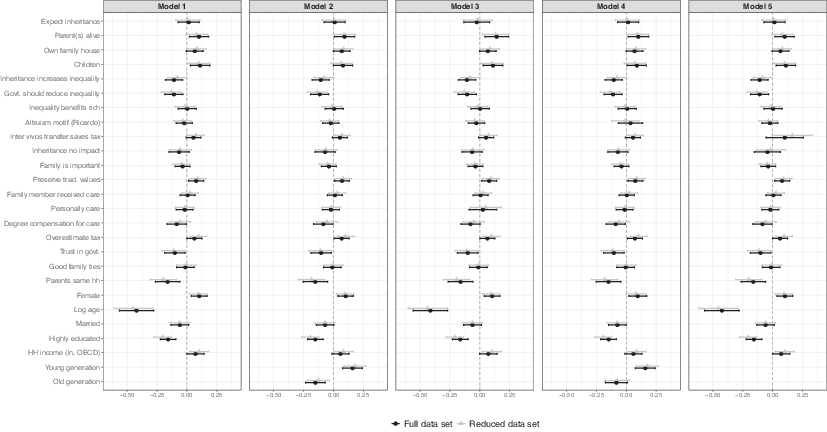
Fig. 3 Comparison of marginal effects and 95% confidence intervals from probit regression models: Full data set versus reduced data without internet users in the mail mode, Bischoff and Kusa (2019)
Fig. 3 shows marginal effects and confidence intervals between the full and reduced GESIS Panel data for all variables that are reported in Bischoff and Kusa (2019) (see Tables 10 to 14 in the Appendix for the numerical results from the original study as well as the full and reduced GESIS Panel data). Compared to Studies 1 and 2, Fig. 3 of study 3 shows more differences between the full and reduced models. In particular, for all five models we observe seven (out of 32) changes which make 22% of the significance levels (for parent(s) alive, children, own family house, degree compensation for care, inheritance increases inequality, overestimate tax and household income). Even though the number of different significance levels seems large compared to Studies 1 and 2 (changes of 16% and 9%), it is essential to note that study 3 deals with a larger number of independent variables and models. As a result, the estimates in study 3 are generally more affected by the lower statistical power resulting from the reduced sample size after excluding Internet users in mail mode. Since the point estimates of the regression coefficients in the models remain largely the same, the deviations between estimates of a complete and reduced GESIS Panel data set seem to result from increased variance rather than bias.
Fig. 4 also presents the overlap measure of the confidence intervals for study 3. The dotted line shows that the majority of confidence intervals of study 3 overlap by more than 80% (50 out of 122) or more than 90% (61), except five intervals which overlap by less than 70% and another six intervals that overlap by around 75%. The overlap of the coefficients’ confidence intervals between the full and reduced models for study 3 ranges from a minimum of 66% to a maximum of 95% with an average of 88%. These results indicate that, again, a removal of unwilling onliners from the data has a rather low impact on the estimates.
If the analysis models include independent variables that predict whether internet users participate in the mail mode, a potential bias in the model estimates will be reduced even if those panelists are removed from the data. The area under the ROC curve reveals how well the models’ independent variables discriminate between unwilling onliners and the panelists of the remaining sample, where Hosmer et al. (2013, p. 177) consider values above 0.7 as a limit for acceptable discrimination (see Appendix Fig. 5). For the independent variables of the full model (model 2) in study 1, the area under the ROC curve is 0.60, for the independent variables of the models in study 2, it is 0.66 and for study 3 (model 4), it is 0.69. These rather low values indicate that nonresponse bias is not substantially reduced because the independent variables of the model correlate with the mode choice of unwilling onliners.
This study explores how offering internet users who are unwilling to be surveyed online the option of responding in the mail mode affects nonresponse bias in a probability-based mixed-mode panel. Data from the German GESIS Panel have been used, in which 24% of all members became a mail mode participant after they refused to join the panel in the web mode. The results demonstrate that unwilling onliners are different in several demographic variables and private internet usage after the recruitment compared to panel members of the web mode or participants assigned to the mail mode because they were not internet users during the panel recruitment. However, the exclusion of unwilling onliners from the GESIS Panel sample hardly introduced a higher bias in estimates of demographic characteristics compared to the ALLBUS as a reference sample. An explanation for a rather small effect on mean estimates could be that the demographic characteristics of unwilling onliners fall between non-internet users in the mail mode and participants choosing the web mode. Nevertheless, a recruitment strategy that does not include unwilling onliners in the sample seems to have consequences for estimating education, as it extends an already existing overrepresentation of highly educated individuals. Further nonresponse bias analyses show how removing unwilling onliners from the analysis affects the mean and model estimates from three reproduced studies published with GESIS Panel data. The findings reveal that several means of variables used in the study models differ significantly between a full and a reduced GESIS Panel data set, indicating the presence of nonresponse bias. However, the models’ point estimates are largely the same after internet users in the mail mode are removed from the analysis. Accordingly, the authors from all three reproduced studies would likely have come to the same conclusions if internet users had not been recruited in the mail mode.
At the same time, the results highlight a key methodological challenge: The exclusion of unwilling onliners led to an increased statistical uncertainty, particularly visible in study 1, where a key finding became non-significant due to wider confidence intervals, despite nearly identical point estimates. This underlines the impact of statistical power on inference, suggesting that the ability to detect effects is substantially reduced when sample sizes decrease. Instead of relying solely on significance thresholds, reporting standards should emphasize effect sizes and uncertainty measures to provide a more comprehensive interpretation of findings. Future research on mixed-mode recruitment strategies should therefore not only assess the reduction of bias but also systematically evaluate how power constraints shape substantive conclusions.
From the total survey error perspective (Biemer and Lyberg 2003, e.g.; Groves et al. 2013, e.g.), the question for online panels is whether offering internet users an option to participate in an alternative mode optimizes the balance between survey errors and survey costs. Beyond the increase in sample size, which was especially relevant in studies 1 and 3, the overall results of this study suggest that the investment in recruiting internet users via the mail mode may not substantially enhance the data quality of a probability-based web and mail panel.
However, this design choice involves an important trade-off. Denying internet users the opportunity to participate in the mail mode or implementing a stricter push-to-web approach would likely reduce survey costs but comes with the potential drawback of achieving a smaller sample for the same recruitment effort. Alternatively, recruiting the same sample size would require more financial and logistical resources, further increasing the cost of recruitment.
The money saved from a stricter push-to-web approach, however, could be reinvested into other design features aimed at reducing survey errors more effectively within the available budget. For example, such resources could fund additional reminder letters specifically for panel members participating in the mail mode, which are currently not implemented in the GESIS Panel due to financial constraints.
However, this conclusion must be drawn with caution. Several factors may limit the ability to draw generalizations from the results of this study and should be considered before an online panel designs its recruitment strategy. First, the analysis comprises only a limited set of variables and reproduced studies. Two studies are from the field of political science and one from the field of economics, which are only two, albeit frequently used, areas of research for which GESIS Panel data are used. A higher extent of nonresponse bias might be found for mean and model estimates in other areas of the social sciences where the variables of interest may be more strongly related to predictors of mode choice in the panel recruitment, such as media usage. This assumption is supported by significant differences in internet usage that was found between a full and a reduced data set. However, what Eckman (2016) found for coverage bias in the LISS panel seems also to be the case for nonresponse bias in the GESIS Panel: estimates of means are more affected by biases than estimates from multivariate models. Second, the results of this study are related to the specific recruitment strategy of the GESIS Panel. The proportion of internet users who do not participate in the web mode and its impact on nonresponse bias depends on the design and recruitment procedures of the online panels. Accordingly, denying internet users an alternative mode may have a different effect in panel studies from other countries and with different mixed-mode approaches. Third, data were analyzed from specific points in time with panel members of up to three cohorts responding in two different modes. Although no evidence was found in this study and in the study ofBach et al. (2023) who analyzed a web-only sample, Cornesse and Schaurer (2021) found decreasing sample accuracy in online panels and speculate that systematic attrition of certain population subgroups is responsible for this finding. Fourth, denying internet users the opportunity to participate in an alternative mode would most likely reduce the recruitment rate of panel studies. A smaller sample size comes with a loss of statistical power and reduced potential for subsample analysis. Depending on research goals and the ability to recruit new members, online panels may have to rely on a strategy that maximizes the recruitment rate of participants.
Furthermore, we examined the potential effects of panel attrition on our findings by conducting sensitivity analyses across different recruitment cohorts. Although the GESIS Panel cohorts and mode groups were affected by varying attrition rates due to differences in the number of panel waves (see Table 1), our results remained consistent across cohorts (see Appendix Tables 15 to 17). Therefore, we found no evidence that selection effects due to panel attrition substantially influenced our results.
In sum, the results of this study provide new insights for establishing or refreshing probability-based online panels using a mixed-mode design. A recruitment procedure that encourages a higher proportion of internet users to participate in the web mode will potentially reduce survey costs without risking a substantial increase of nonresponse bias. However, more research is needed to back this conclusion. Specifically, this study should be replicated to include primary studies in which the research question itself is likely to interact with self-selection in a specific mode. Examples could be questions about attitudes towards data sharing and privacy, media use, or questions addressing specific target groups such as the elderly.
For example, an experimental design to test different recruitment strategies for unwilling onliners would provide deeper evidence into how to balance survey errors and survey costs in the implementation of panel studies. In addition, further research could explore which selection process motivates internet users to refuse to participate in the web mode, or the extent to which potential nonresponse can or cannot be ignored or corrected by weighting or imputation techniques.
Bach, R. L., Cornesse, C., & Daikeler, J. (2023). Equipping the offline population with internet access in an online panel: Does it make a difference? Journal of Survey Statistics and Methodology. https://doi.org/10.1093/jssam/smad003. a, b, c
Bethlehem, J. (2010). Selection bias in web surveys. International Statistical Review, 78(2), 161–188. https://doi.org/10.1111/j.1751-5823.2010.00112.x. →
Biemer, P., & Lyberg, L. E. (2003). Introduction to survey quality. Hoboken: Wiley. https://doi.org/10.1002/0471458740. →
Bischoff, I., & Kusa, N. (2019). Should wealth transfers be taxed? evidence from a representative german survey. Public Finance Review, 47(4), 635–661. a, b, c, d, e, f, g, h, i
Blom, A. G., Bosnjak, M., Cornilleau, A., Cousteaux, A.-S., Das, M., Douhou, S., & Krieger, U. (2015). A comparison of four probability-based online and mixed-mode panels in europe. Social Science Computer Review, 34(1), 8–25. https://doi.org/10.1177/0894439315574825. a, b
Blom, A. G., Herzing, J. M. E., Cornesse, C., Sakshaug, J. W., Krieger, U., & Bossert, D. (2017). Does the recruitment of offline households increase the sample representativeness of probability-based online panels? evidence from the german internet panel. Social Science Computer Review, 35(4), 498–520. https://doi.org/10.1177/0894439316651584. a, b, c
Bosnjak, M., Dannwolf, T., Enderle, T., Schaurer, I., Struminskaya, B., Tanner, A., & Weyandt, K. W. (2018). Establishing an open probability-based mixed-mode panel of the general population in Germany: The GESIS Panel. Social Science Computer Review, 36(1), 103–115. https://doi.org/10.1177/0894439317697949. a, b, c, d, e, f
Bretschi, D., & Weiß, B. (2022). How do internet-related characteristics affect whether members of a german mixed-mode panel switch from the mail to the web mode? Social Science Computer Review, 41(2), 674–701. https://doi.org/10.1177/08944393221117267. →
Bretschi, D., Schaurer, I., & Dillman, D. A. (2023). An experimental comparison of three strategies for converting mail respondents in a probability-based mixed-mode panel to internet respondents. Journal of Survey Statistics and Methodology, 11(1), 23–46. https://doi.org/10.1093/jssam/smab002. a, b
Callegaro, M., & Disogra, C. (2008). Computing response metrics for online panels. Public Opinion Quarterly, 72(5), 1008–1032. https://doi.org/10.1093/poq/nfn065. a, b
Callegaro, M., Baker, R., Bethlehem, J., Goritz, A. S., Krosnick, J. A., & Lavrakas, P. J. (2014). Online panel research. In Online panel research: A data quality perspective (pp. 1–22). Hoboken: Wiley. https://www.ebook.de/de/product/21889020/callegaro_online_panel_research.html. →
Cornesse, C., & Schaurer, I. (2021). The long-term impact of different offline population inclusion strategies in probability-based online panels: Evidence from the german internet panel and the GESIS panel. Social Science Computer Review. https://doi.org/10.1177/0894439320984131. a, b, c, d, e, f
Cornesse, C., Felderer, B., Fikel, M., Krieger, U., & Blom, A. G. (2022). Recruiting a probability-based online panel via postal mail: Experimental evidence. Social Science Computer Review, 40(5), 1259–1284. https://doi.org/10.1177/08944393211006059. →
Couper, M. P. (2008). Designing effective web surveys. New York: Cambridge University Press. https://doi.org/10.1017/cbo9780511499371. →
Couper, M. P., Kapteyn, A., Schonlau, M., & Winter, J. (2007). Noncoverage and nonresponse in an internet survey. Social Science Research, 36(1), 131–148. https://doi.org/10.1016/j.ssresearch.2005.10.002. →
Das, M., Kapteyn, A., & Bosnjak, M. (2018). Open probability-based panel infrastructures. In D. L. Vannette & J. A. Krosnick (Eds.), The PalgraveHandbook of Survey Research (pp. 199–209). Cham: Springer. https://doi.org/10.1007/978-3-319-54395-6_25. ISBN 978-3-319-54395‑6. →
Dennis, J. M. (2019). Technical Overview of the AmeriSpeak Panel NORC’s Probability-Based Household Panel. NORC at the University of Chicago. →
Dillman, D. A., Smyth, J. D., & Christian, L. M. (2014). Internet, phone, mail, and mixed-mode surveys (4th edn.). Hoboken: Wiley. →
Eckman, S. (2016). Does the inclusion of non-internet households in a web panel reduce coverage bias? Social Science Computer Review, 34(1), 41–58. https://doi.org/10.1177/0894439315572985. a, b, c, d, e, f, g
Eckmann, S. (2013). Paradata in coverage research. In F. Kreuter (Ed.), Improving surveys with paradata: Analytic uses of process information (pp. 339–359). New York: Wiley. →
Felderer, B., & Herzing, J. M. E. (2023). What about the less IT literate? a comparison of different postal recruitment strategies to an online panel of the general population. Field Methods, 35(3), 219–235. https://doi.org/10.1177/1525822X221132940. →
GESIS (2020). Gesis panel—extended edition a, b
Gherghina, S., & Geissel, B. (2019). An alternative to representation: Explaining preferences for citizens as political decision-makers. Political Studies Review, 17(3), 224–238. https://doi.org/10.1177/1478929918807713. a, b, c, d, e, f, g, h, i
Greenlaw, C., & Brown-Welty, S. (2009). A comparison of web-based and paper-based survey methods testing assumptions of survey mode and response cost. Evaluation Review, 33(5), 464–480. https://doi.org/10.1177/0193841x09340214. →
Groves, R. M., Fowler, F. J., Couper, M. P., Lepkowski, J. M., & Singer, E. (2013). Survey methodology. Number 2. Hoboken: Wiley. ISBN 978-1-118-21134‑2. a, b
Heinisch, R., & Wegscheider, C. (2020). Disentangling how populism and radical host ideologies shape citizens’ conceptions of democratic decision-making. Politics and Governance, 8(3), 32–44. https://doi.org/10.17645/pag.v8i3.2915. a, b, c, d, e, f, g, h, i
Herzing, J. M. E., & Blom, A. G. (2019). The influence of a person’s digital affinity on unit nonresponse and attrition in an online panel. Social Science Computer Review, 37(3), 404–424. https://doi.org/10.1177/0894439318774758. →
Holm, S. (1979). A simple sequentially rejective multiple test procedure. Scandinavian Journal of Statistics, 65–70. a, b, c
Hoogendoorn, A., & Daalmans, J. (2009). Nonresponse in the recruitment of an internet panel based on probability sampling. Survey Research Methods, 3(2), 59–72. →
Hosmer, D. W., Lemeshow, S., & Sturdivant, R. X. (2013). Applied logistic regression. Vol. 398. Wiley. https://doi.org/10.1002/9781118548387. →
Jessop, C. (2017). Developing the NatCen panel—August 2015–July 2017. techreport. National Centre for Research Methods (NCRM). a, b
Kaczmirek, L., Phillips, B., Pennay, D. W., Lavrakas, P. J., & Neiger, D. (2019). Building a probability-based online panel: Life in Australia. CSRM and SRC Methods Paper. →
Karr, A. F., Kohnen, C. N., Oganian, A., Reiter, J. P., & Sanil, A. P. (2006). A framework for evaluating the utility of data altered to protect confidentiality. The American Statistician, 60(3), 224–232. https://doi.org/10.1198/000313006x124640. →
Kolb, J.-P., Bruch, C., Sand, M., & Weyandt, K. (2020). Gesis panel data manual related to za5664 and za5665 updated with wave ge (october/november 2019) version 36-0‑0. techreport. Köln: GESIS—Leibniz-Institut for Social Sciences. →
Kreuter, F., Presser, S., & Tourangeau, R. (2008). Social desirability bias in CATI, IVR, and web surveys: the effects of mode and question sensitivity. Public Opinion Quarterly, 72(5), 847–865. https://doi.org/10.1093/poq/nfn063. →
Leenheer, J., & Scherpenzeel, A. C. (2013). Does it pay off to include non-internet households in an internet panel? International Journal of Internet Science, 8(1), 17–29. a, b
de Leeuw, E. D. (2005). To mix or not to mix data collection modes in surveys. Journal Of Official Statistics, 21(2), 233–255. →
de Leeuw, E. D., & Hox, J. J. (2014). Survey mode and mode effects. In Improving survey methods (pp. 22–34). Routledge. →
de Leeuw, E. D. (2018). Mixed-mode: past, present, and future. Survey Research Methods, 12(2), 75–89. https://doi.org/10.18148/srm/2018.v12i2.7402. →
Pforr, K., & Dannwolf, T. (2017). What do we lose with online-only surveys? estimating the bias in selected political variables due to online mode restriction. Statistics, Politics and Policy, 8(1), 105–120. a, b, c
R Core Team. (2024). R: A language and environment for statistical computing. Vienna: R Foundation for Statistical Computing. https://www.R-project.org/
Revilla, M., Cornilleau, A., Cousteaux, A.-S., Legleye, S., & de Pedraza, P. (2015). What is the gain in a probability-based online panel of providing internet access to sampling units who previously had no access? Social Science Computer Review, 34(4), 479–496. https://doi.org/10.1177/0894439315590206. a, b
Robinson, J. P., Neustadtl, A., & Kestnbaum, M. (2002). The online diversity divide: Public opinion differences among internet users and non-users. IT & Society, 1(1), 284–302. →
Rookey, B. D., Hanway, S., & Dillman, D. A. (2008). Does a probability-based household panel benefit from assignment to postal response as an alternative to internet-only? Public Opinion Quarterly, 72(5), 962–984. https://doi.org/10.1093/poq/nfn061. a, b, c, d
Schaurer, I. (2017). Recruitment strategies for a probability-based online panel:Effects of interview length, question sensitivity, incentives andinterviewers. phdthesis. Mannheim University. Doctoral dissertation. https://madoc.bib.uni-mannheim.de/42976/1/Dissertation_Schaurer-1.pdf →
Schaurer, I., & Weyandt, K. (2016). GESIS Panel technical report: Recruitment 2016 (wave d11 and d12). techreport. Köln: GESIS—Leibniz Institute for the Social Sciences. https://dbk.gesis.org/dbksearch/download.asp?id=63525 →
Schaurer, I., Struminskaya, B., & Enderle, T. (2014). Gesis panel technical report—welcome survey (wave a12). techreport. Köln: GESIS—Leibniz Institute for the Social Sciences. https://access.gesis.org/dbk/76818 →
Schaurer, I., Minderop, I., Bretschi, D., & Weyandt, K. (2020). GESIS Panel technical report: Recruitment 2018 (f11 and f12). techreport. Köln: GESIS—Leibniz Institute for the Social Sciences. https://access.gesis.org/dbk/68670 →
Schnell, R., Noack, M., & Torregroza, S. (2017). Differences in general health of internet users and non-users and implications for the use of web surveys. Survey Research Methods, 11(2), 105–123. https://doi.org/10.18148/SRM/2017.V11I2.6803. →
Schober, M. F. (2018). The future of face-to-face interviewing. Quality Assurance in Education, 26(2), 290–302. →
Sterrett, D., Malato, D., Benz, J., Tompson, T., & English, N. (2017). Assessing changes in coverage bias of web surveys in the united states. Public Opinion Quarterly, 81(S1), 338–356. https://doi.org/10.1093/poq/nfx002. →
Struminskaya, B., Kaczmirek, L., Schaurer, I., & Bandilla, W. (2014). Assessing representativeness of a probability-based online panel in Germany. In Online panel research: A data quality perspective (pp. 61–85). West Sussex: Wiley. →
Terwey, M. (2000). Allbus: A german general social survey. Schmollers Jahrbuch, 120(1), 151–158. →
Teshome Hailemeskel, A. (2019). The derivation and choice of appropriate test statistic (z, t, f and chi-square test) in research methodology. Mathematics Letters, 5(3), 33. https://doi.org/10.11648/j.ml.20190503.11.
Toepoel, V., & Hendriks, Y. (2016). The impact of non-coverage in web surveys in a country with high internet penetration: Is it (still) useful to provide equipment to non-internet households in the netherlands? International Journal of Internet Science, 11(1), 33–50. a, b
Weiß, B., Das, M., Kapteyn, A., Bosnjak, M., & Schaurer, I. (2020). Open probability-based panels. In Wiley StatsRef: Statistics reference online (pp. 1–8). Hoboken: Wiley. https://doi.org/10.1002/9781118445112.stat07988. →
Zhang, C., Callegaro, M., Thomas, M., & DiSogra, C. (2009). Do we hear different voices?: Investigating the differences between internet and non-internet users on attitudes and behaviors. In Proceedings of the section on survey research methods (pp. 6063–6076). American Statistical Association. →