Cross-national surveys provide a unique source of comparable information for countries, allowing researchers to investigate whether and why given populations think and behave differently. However, examining social issues across socio-cultural settings creates challenges related to survey design, measure equivalence and fieldwork practice (Lynn et al., 2007; Koch & Blohm, 2009; Eckman & Koch, 2019). Although many of these issues have been studied extensively in the survey literature (cf. Johnson et al., 2018), item nonresponse—that is, a respondent not responding to a specific question despite agreeing to participate in a survey (Yan & Curtin, 2010)—has received little attention from a cross-national perspective. While item nonresponse may take the form of either a ‘don’t know’ response or a refusal to answer a question (Shoemaker et al., 2002), both options stem from distinct underlying causes of nonresponse that often overlap, one related to the difficulty in formulating a response and the other reflecting a preference to not answer a question at all.
This article focuses on a question measuring total net household income in the European Social Survey (ESS) (2008–2018). It assesses two mechanisms—task complexity and question sensitivity—which explain why respondents refrain from answering a question on income. A ‘don’t know’ answer may appear to be a valid but uninformative response and a direct consequence of the task complexity, especially when the question is perceived as difficult because it asks about a complex phenomenon, a hard-to-recall behaviour or poses hypothetical or abstract situations (Converse, 1976; Yan, Curtin, & Jans, 2010). If a question is overly sensitive and respondents fear disapproval when answering, they are more likely to refuse to provide information during an interview, for example, after considering the costs and benefits of revealing their income to an interviewer (Schräpler, 2004, 2006).
Improving the current understanding of income nonresponse patterns and potential bias introduced by missing information on household income is essential for methodological and substantial reasons. Income is the most straightforward measure of socioeconomic status and is highly correlated with other outcomes (Korinek, Mistiaen, & Ravallion, 2006; Hansen & Kneale, 2013). Hence, not reporting income might lead to distorted conclusions for other variables (Jabkowski & Piekut, 2023; Lahtinen et al., 2019; Hariri & Lassen, 2017). On the one hand, income can be used as a relative predictor of individual outcomes, such as life satisfaction (Lelkes, 2006), and is a key control variable when exploring socio-political attitudes, including perceptions of immigration and support for welfare (Herda, 2013; Daniele & Geys, 2015). On the other hand, empirical studies often omit income as a control or explanatory variable due to a high item nonresponse rate (Meuleman et al., 2020), which can affect the results if an income is correlated with any other predictor or with the dependent variable in a study. In both cases, problems arise when the income levels of respondents who answer the question differ systematically from those who do not, as this situation may lead to biased estimations, even if missing data are imputed.
This article makes two principal contributions to the current state of the art. First, our study focused on the ESS, Europe’s most impactful and methodologically advanced cross-national survey on political, social and health-related issues (Fitzgerald & Jowell, 2010; Fitzgerald, 2015; Kolarz et al., 2017). To the best of our knowledge, this is the first systematic analysis of the mechanisms shaping income nonresponse from a cross-national perspective based on the ESS data. Previous studies have jointly investigated item nonresponse for all ESS questions (Koch & Blohm, 2009; Beullens et al., 2018) or focused on specific opinion or attitude items (Herda, 2013; Callens & Loosveldt, 2018; Piekut, 2021; Purdam et al., 2020; Silber et al., 2021). Meanwhile, the income question warrants further study. It had the highest nonresponse rate of all ESS questions, reaching 20–40% in 2018 in Czechia, Hungary, Ireland, Poland, Switzerland and Spain.
Second, we extended task complexity and question sensitivity approaches by situating them in the context of national cultures that provide mental reference frameworks for opinion formation and survey (non)response (Sicinski, 1970). Consequently, we argue that the rate of item nonresponse varies depending on culture-specific values and people’s behaviours (Johnson et al., 2002). In our approach, we explore whether survey participants will be more likely to play the role of a ‘good’ respondent and provide all requested information in cultures where collaboration with others is rewarded and socially expected or where income is not considered a sensitive topic. Thus, in our study, we explore not only how both mechanisms—task complexity and question sensitivity—impact item nonresponse at the respondent level but also how the two mechanisms are conditional on relevant characteristics of national cultures.
Due to the respondents’ right to abstain, there is always a possibility that some valuable information may be missing from survey data. Item nonresponse could be considered through the broader prism of survey satisficing, which addresses the likelihood of a respondent providing a ‘truthful’ answer relative to their abilities and motivation and the task’s difficulty (Krosnick, 1991; Krosnick et al., 2002). Weak satisficing occurs when a respondent cognitively engages with a question but rushes the answer process or edits it slightly. It might manifest in a particular response style when answering a question, such as order effect or acquiescence bias (Varenbergh & Thomas, 2013). Strong satisficing is likely if a respondent with low motivation requires more cognitive effort to answer the question, thus struggling to construct estimates or express an opinion. As a result, some of the information processing might be skipped altogether. Item nonresponse is an example of strong satisficing, as the respondent decides not to answer after some reflection and realises they cannot or do not want to provide a ‘valid’ response (Cornesse & Blom, 2020). However, the reasons for satisficing through nonresponse can vary.
In our conceptual framework, we posit that income nonresponse is affected by respondent-level characteristics and differences in the national context in which the interview takes place. At the respondent level, the complexity of their income situation contributes to the cognitive effort needed to answer the question (Skelton, 1963; Riphahn & Serfling, 2005; Frick & Grabka, 2014). Additionally, some respondents might avoid answering this question because it requires submitting personal information (Tourangeau, Groves, & Redline, 2010). Moreover, how respondents produce their answers—or abstain from answering—is shaped by the socio-cultural contexts in which their thinking is embedded (Klíma et al., 2023; Lee et al., 2017). We elaborate on these nonresponse aspects below.
The first crucial mechanism that explains item nonresponse is task complexity. During the cognitive process of answer formulation, the response to a question on income might be affected by issues related to recall (e.g. when respondents forget about a source of income) and reconciliation (e.g. when income complexity leads to calculation errors) (Hansen & Kneale, 2013). Thus, the likelihood of selecting the ‘don’t know’ option is conditional on respondents’ cognitive abilities, which are associated with their age and formal education level (Kaminska et al., 2010). It is also possible that a respondent may truly not have a substantive answer to a factual question, and the ‘don’t know’ response is a valid and informative answer (Kuha et al., 2018). Furthermore, respondents’ knowledge of their income is not binary; it falls into a few cognitive states depending on information availability (i.e. whether it is easily retrievable), accessibility (whether it is retrievable with effort), generatability (whether it is not known but can be estimated), and whether it is estimable at all (Beatty & Hermann, 2002). Thus, when assessing relevant income information is challenging for a respondent due to any of the listed reasons, the difficulty of the question will increase the occurrence of ‘don’t know’ responses (Olson et al., 2019).
The design of the income question is yet another factor leading to its cognitive difficulty (Converse, 1976). The nonresponse rate to the income question depends on how the question is operationalised, for example, whether it measures individual or household income before or after tax (Locander & Burton, 1976; Moore & Loomis, 2002; Lynn et al., 2006). Many surveys, including the ESS, ask respondents to perform calculations and provide the aggregate household income from all sources after deductions and taxes. When asked about their total household net income, respondents must include various factors in their calculations, such as salaries, additional work allowances, benefits, income from properties or any other passive income (e.g. investments) for all household members, and then subtract paid taxes and interest. Thus, nonresponse is affected by the number of income sources that respondents must recall, add and deduct for all household members (Pleis & Dahlhamer, 2003).
Consequently, income nonresponse is impacted by a respondent’s employment situation and each household member’s contribution to the total household income (Lynn et al., 2006). A respondent may not be sure about the income value if they or some household members are not employed full-time and do not receive regular and stable salaries. Rather, some individuals may be self-employed or take on temporary or part-time jobs. Consequently, respondents whose income relies solely on stable salaries, regular benefits or pensions are more likely to provide income estimates than respondents with less regular income sources (Schräpler, 2006).
Income complexity is also a function of household size. The greater the number of adults in a household, the more likely it is that the respondent will not know the total household income (Frick & Grabka, 2014). Furthermore, income nonresponse is related to household structure, for example, the number of generations and families living together and sharing expenses (Hansen & Kneale, 2013) and their living arrangements (e.g. divorced families, stepfamilies and blended families).
Question sensitivity is the second crucial mechanism driving income nonresponse. While cognitively demanding questions result in more ‘don’t know’ responses, sensitive questions elicit more refusals (Shoemaker et al., 2002). Thus, refusing to answer indicates that the respondents find the income question too sensitive to provide a substantive answer and that the perceived costs of sharing the information are too high (Skelton, 1963; Alwin & Krosnick, 1991; Koch & Blohm, 2009).
Although the purpose of the income question is to measure a piece of information, the question is also perceived as sensitive by many respondents (Tourangeau, Groves, & Redline, 2010). For instance, respondents may consider a survey question too sensitive if they fear that their responses will be disclosed or that their answer could be perceived as socially undesirable (i.e. it goes against dominant norms and values; Tourangeau & Yan, 2007). Overall, when answering survey questions, respondents consider the costs and benefits of sharing information about their income. Thus, according to rational choice theory, their decision not to provide a substantive answer depends on the perceived consequences of answering truthfully, including stress related to privacy invasion, data confidentiality concerns and personal interest in the research (i.e. disapproving of or recognising the meaningful purpose of the survey; Schräpler, 2004). Such costs are higher in face-to-face interviews because revealing personal information to a stranger is more likely to be outside the respondent’s comfort zone and refusing to answer brings more discomfort than in a self-administered interview (Krumpal, 2013), where information might be more easily skipped.
Not all respondents find the income question equally sensitive. A study on the German Socio-Economic Panel (SOEP) reported that the refusal rate was higher for respondents in high-level job positions (Schräpler, 2004). A higher refusal likelihood among highly skilled respondents could be motivated by a fear of information disclosure if higher skills correlate with higher income. Alternately, respondents with the highest skills might be aware that their income is lower than socially expected for their occupation. A study comparing survey-reported income with register-based data found that high-income individuals were more likely to overestimate it, indicating socially desirable responding for that group (Hariri & Lassen, 2017).
Previous studies suggest that income nonresponse due to question sensitivity is related to personal values and normative beliefs. First, income nonresponse correlates with the respondents’ general trust in other people. Low-trust citizens are more likely to conceal their incomes than other citizens (D’Hernoncourt & Méon, 2012; Kim et al., 2015), as they find it harder to develop rapport with interviewers and have less trust in the researchers conducting. Second, the sensitivity of the income question results in ‘impression management’ during an interview, which makes some respondents less likely to report their income in order to minimise negative emotions and a potential negative reaction by the interviewer (Krumpal, 2013). Hence, some income nonresponse is motivated by a desire for social approval and to sustain a positive self-image during a survey interview. Socially desirable responding correlates with the conservation vs openness to change dimension of basic human values (Schwartz et al., 1997). Thus, respondents who prioritise conformity and security (i.e. conservation measures) over self-direction and stimulation (openness to change measures) are less likely to report their incomes. They do so because they seek to avoid violating social expectations regarding a perceived, acceptable income level.
So far, we have focused on respondents’ characteristics reflecting their knowledge, ability, motivation and attitudes towards answering an income question and how they might affect item nonresponse. However, this process does not happen in a vacuum. Rather, respondents are situated in different socio-cultural contexts where they have been socialised and in which they live. The effect of cross-country differences on data missingness remains an unexplored issue in comparative surveys. The considerable variation in average nonresponse rates across cross-national surveys, such as the ESS, is a consequence of cultural differences between countries and dissimilarities in how survey organisations conduct the survey across countries (Billiet et al., 2007; Koch & Blohm, 2009; Silber & Johnson, 2020).
Cross-national variation in unit and item nonresponse patterns has been observed in a few studies using country-level measures of population diversity, economic outcomes or dominant cultural values (Johnson et al., 2010; Klíma et al., 2023; Piekut, 2021; Meitinger & Johnson, 2020). Following that body of literature, we argue that our understanding of income nonresponse can be improved by exploring differences between countries related to cognitive skills, the tendency to misreport income and selected dimensions of Hofstede’s cultural orientation theory, specifically uncertainty avoidance and masculinity/femininity values (Hofstede & Bond, 1984).
Countries and their national cultures constitute a pivotal mental reference framework for opinions and behaviours, including survey participation and (not) responding to surveys (Johnson et al., 2002; Sicinski, 1970). In the case of the income question, the ways people think about income varies internationally. For example, in some countries, e.g., in Poland, it is common to discuss their net monthly salary, while in other, like in the UK, annual gross income is rather used to describe work pay. Individuals’ cognitive ability to perform estimates might be also affected by how well they are equipped with numerical skills through compulsory education. Thus, average national numeracy scores are likely to be associated with income nonresponse patterns and the likelihood of replying ‘don’t know’ (Lee et al., 2017).
In addition, respondents in cultures with higher uncertainty avoidance will avoid providing ambiguous answers in surveys and have a lower tendency to leave questions unanswered (Klíma et al., 2023; Meitinger & Johnson, 2020). However, this might not be the case for all kinds of questions. The more future oriented a country’s culture is, that is, where more cognitive attention is given to future planning, the lower the nonresponse rates to subjective probability questions will be (i.e. predicting their own future) (Lee et al., 2017). On the contrary, people in some cultures are more anxious when faced with uncertainty and do not cope well with ambiguity in social situations (Hofstede et al., 2010). Uncertainty avoidance is also correlated with conservatism in financial reporting practices (Zahid et al., 2018). As such, respondents in cultures characterised by higher uncertainty avoidance will refrain from replying “don’t know” to the income question because they feel more comfortable in the structured situation of a survey interview and accept the role of a ‘good’ respondent, and they are thus more likely to give substantive responses to questions.
As noted by Hariri and Lassen (2017), the provision of socially desirable answers about income and income misreporting are likely to vary across national contexts and depend on the dominant political ideologies and economic systems. In other words, in some national contexts, the topic of personal finances and income is considered to be highly sensitive, and disclosing such information to people outside one’s close social circle is considered inappropriate. In more individualistic societies and where public institutions are less trusted in general, the acceptance of not following the law, including not reporting income to tax authorities, is more accepted (Achim et al., 2019). Other research has found that people who misreport income to tax authorities are also more likely to repeat this behaviour in surveys (Hurst et al., 2014), indicating that such respondents might be motivated by data disclosure fears. From this, we could infer that in countries where the overall level of income misreporting is higher, the likelihood of not answering and specifically refusing to answer the income question due to the sensitivity of the topic will be higher.
Income question sensitivity is a culture-specific issue. Hofstede’s masculinity/femininity value dimension provides another useful perspective for improving our understanding of cross-national variation in income nonresponse. It posits that in more masculine societies, financial resources are more valued, and the tendency to compete is higher than in more feminine cultures, in which people are more oriented towards social and family values and helping others is more highly valued (Hofstede & Bond, 1984; Johnson et al., 2010). Additionally, in more masculine cultures, earnings management practices, including misreporting and concealing income, are more common (Geiger et al., 2006). As such, income—especially if there is a fear that it is not high enough—will be seen as a more sensitive piece of information in societies that are more masculine oriented.
Task complexity increases ‘don’t know’ responses (H1): Following the literature, (1) respondents who live in larger households that have more sources of income (H1a) and (2) respondents whose primary source of income does not come from a stable source (H1b) are more likely to provide ‘don’t know’ responses.
Question sensitivity increases ‘refuse to say’ responses/refusals (H2): Income nonresponse is also related to question sensitivity, which is more likely to be given as a refusal to answer in this case. We identified two possible pathways for this: (1) a lower level of social trust (related to fear of disclosure) increases probability for refusals (H2a), and (2) conservation values lead to an increased inclination not to violate perceived social expectations regarding income levels and will result in a higher probability of refusals (H2b).
Cross-country differences and task complexity (H3): Considering the task complexity argument, we expect the likelihood of ‘don’t know’ responses to be higher (1) in countries with lower adult numeracy skills, as calculating the total net household income question is harder (H3a), and (2) lower when the respondent lives in a country with higher uncertainty avoidance, so they are more inclined to follow the survey interview rules (H3b).
Cross-country differences and question sensitivity (H4): According to the question sensitivity argument, we expect a higher likelihood of ‘refuse to say’ responses in countries where income misreporting is more common, so income is viewed as a more sensitive topic (H4a), and among respondents who live in countries with higher masculinity values (H4b).
In this section, we describe the ESS data used to explore two mechanisms responsible for the likelihood of nonresponse to the income question: task complexity and question sensitivity. We apply multilevel logistic regressions with respondents nested within interviewers, countries and ESS rounds to model two income nonresponse options: ‘don’t know’ answers and refusals to answer the question. We introduce explanatory variables that we use at the respondent and country levels to investigate whether both tested mechanisms operate in the income question. Finally, we describe the control variables, including respondent, interviewer and survey characteristics.
The ESS is a well-established cross-national survey that has been conducted biennially since 2002. Only probability samples are allowed (Kaminska & Lynn, 2017), and careful attention is paid to achieve optimal measurement comparability across countries (Fitzgerald, 2015). Interviews are conducted entirely face to face by trained interviewers (using either paper and pencil, a computer or mobile devices for data collection) with individuals at least 15 years of age who live in private households within a country’s borders, irrespective of their nationality, citizenship, language and legal status (Lynn et al., 2007).
Although 22 to 31 countries have participated in various rounds of the ESS, with 38 countries participating in at least one round, we restricted our analyses to the 17 countries that participated in all rounds from 4 to 9 (2008–2018). We excluded data from rounds 1–3 (2002–2006), as no information on the gender and age of the interviewer was available (we used both variables to control inter-interviewer variation in the occurrence of item nonresponse), and—more importantly—a different method for measuring household income was implemented in the first three rounds of the ESS (Warner & Hoffmeyer-Zlotnik, 2006). We also excluded data on Sweden—although the country participated in all rounds of the ESS—due to an incongruence in the way the interviewer’s age was coded. Additionally, we removed three national surveys, namely ESS round 5 in Portugal and ESS round 7 in Estonia (both of which measured household total net income inconsistently with ESS requirements) and ESS round 4 in Lithuania (as the national dataset does not contain design weights). For detailed information about the net sample sizes in each of the national surveys encompassed by the analyses, please consult Figure B1 in the online supplementary and replication materials.
We make use of three complementary types of publicity available ESS datasets (ESS, 2008, 2010, 2012, 2014, 2016, 2018e) by combining (1) standard cumulative data containing survey results from rounds 4–9 with additional data derived from the (2) interviewers’ questionnaires, which are self-completion forms that the interviewers complete once the interview with the selected respondent is successfully conducted; they also collect information about the interviewers, such as their gender and age. We also used (3) survey documentation reports (ESS, 2018a, b, c, d, 2020, 2021), which provide country-specific information on data collectors, funding agencies, sampling and fieldwork procedures and survey outcomes. The following section presents detailed information about all the variables used in our analysis. The exact wording of the ESS questions is presented in Section A of the online supplementary and replication materials.
In ESS rounds 4–9, respondents answering the question on income had to assign their household total net income to one of ten categories based on deciles of the actual household income distribution in the given country. Interviewers displayed a showcard with approximate weekly, monthly or annual income expressed in the national currency. It is important to note that the actual income amounts did not appear on the questionnaire but only on the showcard, potentially strengthening the respondents’ feeling of confidentiality. The two nonresponse options—‘refuse to say’ and ‘don’t know’—were not explicitly given to the respondent; however, the interviewer could record one of the options when offered spontaneously. In order to standardise interviewing and minimise the room for interviewers to decide which nonresponse option was finally recorded, interviewers were trained and presented with question-reading instructions that they must follow. Concerning the ‘don’t know’ answer and ‘refuse to say’, both nonresponse options were forbidden to be read out to respondents (ESS, 2018f: 15).
The wording of the income question in ESS rounds 4–9 was as follows:
“Using this card, please tell me which letter describes your household’s total income, after tax and compulsory deductions, from all sources. If you don’t know the exact figure, please give an estimate. Use the part of the card that you know best: weekly, monthly or annual income.” (ESS, 2018g: 60)
As can be seen, respondents are encouraged to provide an estimate if they are not sure about their exact net household income, and they can use weekly, monthly or annual periods, which potentially lowers task complexity. However, as discussed previously, the question still seems quite complex, as a respondent has to add income from various sources, for all household members, and provide a net sum.
We created a dependent variable, taking values of 0, 1 and 2, representing three categories of respondents. All those who responded with their household’s total net income were coded as 0, those who replied ‘don’t know’ were coded as 1 and those who refused to answer were coded as 2.
To test the task complexity argument at the respondent level, we included two explanatory variables: household size (i.e. the number of people aged 15+ living in a household) and the main source of household income. Household size was established by asking respondents how many people (including children and the respondent) regularly lived there as household members. Since school-age children are much less likely to have an income, same-size households may be differently affected by the task complexity mechanism, depending on whether they consist of only adults or both adults and children. Thus, when counting household size, we included only people eligible to participate in a survey, that is, those who were at least 15 years old, the European employment age limit for teenage workers. Additionally, as we decided that all independent numerical variables on the respondent level would have a value of 0 (this decision makes it easier to interpret the intercept term in increasingly complex regression models and does not change the interpretation and significance level of the regression parameters), we subtracted the respondent from the number of household members. Thus, 0 indicated that no person other than the respondent lived in the household.
All ESS rounds recorded the primary source of household income. This was a single-choice question that was presented just before the net household income question. Respondents were asked to consider the income of all household members and any revenue that the household may receive as a whole and can choose one from the following: (1) wages or salaries (we established this as a reference category); (2) pensions; (3) unemployment/redundancy benefits or any other social benefits or grants; (4) income from investments, savings or other sources; and (5) income from self-employment or farming. We also included the nonresponse option ‘don’t know’ and refusals in the data analysis as additional values for this categorical variable.
To test whether the income question sensitivity argument works at the respondent level, we included two independent variables: the social trust index and the conservation vs openness to change measure as a proxy for social desirability. We created an index of social trust as an average of three 11-point scale items asking respondents about interpersonal or horizontal trust between citizens (Reeskens & Hooghe, 2008)—the higher the value, the more the respondent trusted others. We standardised the social trust index by calculating z‑scores across all respondents.
As the ESS does not contain any items directly measuring social desirability, we derived eight items from a 21-item version of the Portrait Values Questionnaire (Schwartz, 2007) to calculate four basic human values (each measured by two items; for details, consult Section A in the supplementary and replication materials): conformity, security, stimulation (with reversed response options) and hedonism (with reversed response option). Finally, we combined eight items into an internally consistent measure of the conservation vs openness to change dimension. This dimension is not a direct measure of social desirability; nevertheless, it can be treated as its proxy. Schwartz et al. (1997) showed a significant positive correlation between social desirability and both conformity and security and a significant negative correlation between social desirability and both stimulation and hedonism. The conservation vs openness to change scale was standardised by calculating the z‑scores across all respondents (higher positive values correspond to more conservation). In Table 1, we present descriptive statistics for all the explanatory variables at the respondent level.
Table 1 Descriptive statistics for all explanatory variables at the respondent level
Variable | Mean/Proportion | Standard deviation | Minimum | Maximum |
HH size (excluding children up to 14) | 1.41 | 1.11 | 0.00 | 18.00 |
Source of income | ||||
Wages or salaries | 0.590 | – | – | – |
Pensions | 0.244 | – | – | – |
Unemployment or any other social benefits | 0.054 | – | – | – |
Income from investments, savings or other | 0.007 | – | – | – |
Income from self-employment or farming | 0.088 | – | – | – |
‘Do not know’ | 0.010 | – | – | – |
Refusal | 0.007 | – | – | – |
Conservation (z-scores) | 0.00 | 1.00 | −4.45 | 4.48 |
Social trust index (z-scores) | 0.00 | 1.00 | −2.29 | 2.73 |
Note, that the social trust index and conservation scale are latent constructs based on three and eight observable variables, respectively. Thus, we evaluated the cross-country configural, metric and scalar invariance of these constructs by employing a multi-group confirmatory factor analysis (MG-CFA). As our study postulates that social trust and conservation are explanatory variables of income nonresponse, we were interested in obtaining at least a metric equivalence of both latent variables, which is a necessary condition to ensure equivalence of the meaning of factors and for comparing correlates of values between different countries (Davidov, 2008). The results of the MG-CFA analysis are presented in the supplementary and replication materials (Tables B1.1. and B1.2.). We used two measures to assess whether the models assuming configural, metric and scalar equivalence restrictions fit the empirical data, namely the comparative fit index (CFI) and the root mean square error of approximation (RMSEA), as both measures are suitable for large samples (Chen, 2007). For each model, we checked whether the CFI was higher than 0.9 and the RMSEA was lower than 0.08, indicating that the models were well fitted to the data (Hu & Bentler, 1999). None of the models supported the scalar invariance assumption. Nevertheless, they supported the cross-country configural and metric invariance of the social trust index and the scale measuring conservation values, which means that any observed differences in the regression’s coefficients are more likely to reflect true differences in the explored relationships rather than differences in measurement quality.
We used two explanatory variables to assess whether the task complexity mechanism works at the country level and explains why countries differ in the overall fraction of respondents providing ‘don’t know’ answers to the household total net income question. First, to operationalise how well citizens are equipped with cognitive abilities to perform complex numeracy estimations, we used the Organisation for Economic Co-operation and Development (OECD, 2023) Mathematics Performance Scale (MPS), which measures the mathematical literacy of 15-year-old students based on the estimates provided by the Programme for International Student Assessment (PISA). The MPS estimates were available for all ESS-participating countries included in our analysis and for five different time points (i.e. 2006, 2009, 2012, 2015, and 2018) in the period coinciding, but not consistent with, the implementation of ESS rounds 4–9. Thus, we calculated the mean MPS value for each country over time. Note that the direct measure of adult numeracy skills (i.e. provided by the OECD’s Survey of Adult Skills [PIAAC]), was not available for all countries included in our analysis. Fortunately, the PISA’s MPS estimates and PIAAC’s adult numeracy scale scores are significantly correlated at the country level (at least for countries where values of both measures were available), as shown in Figure B2 in the online supplementary and replication materials. Thus, we used MPS estimates of 15-year-old students as a proxy for adult numeracy skills. Second, we used Hofstede’s Uncertainty Avoidance Index (UAI) to operationalise citizens’ overall tendency to avoid uncertainty. We derived the most current UAI estimates (2012) online (https://geerthofstede.com/wp-content/uploads/2016/08/6-dimensions-for-website-2015-08-16.csv).
We also included two explanatory variables at the country level that are related to the question sensitivity argument: the tendency to misreport income due to fears of data disclosure to tax authorities and the preference to prioritise financial resources in societies that are more oriented towards masculinity values. The overall country-level tendency to avoid reporting income to tax authorities was operationalised by measuring the size of the shadow economy (as the percent of official GDP), and the societal orientation on masculinity values was operationalised by employing Hofstede’s Masculinity vs Femininity Index (MAS). The 2012 estimates of MAS were derived from the Hofstede database from the link mentioned above, while the data describing the size of the shadow economy were obtained from the European Parliament report on the taxation of the informal economy in the European Union (Schneider & Asllani, 2022: 14–15).
Data on the shadow economy were available for each ESS-participating country and the years corresponding to ESS rounds 4–9 (i.e. we had specific data for every single national survey included in our study). In turn, for three other country-level explanatory variables, we only had access to the country values from a specific year (in the case of UAI and MAS, for 2012), or we aggregated data at the country level from several time points (as for MPS). This decision means that for UAI, MPS and UMI, each country survey received the same value over time regardless of the year in which the corresponding ESS round was conducted. Table 2 presents descriptive statistics for all four country-level variables. In the regression models, we centred each variable around its grand mean across all countries, which was motivated by the same reasons we set up a zero value for each numerical variable in our study.
Table 2 Descriptive statistics for all explanatory variables at the country level
Variable | Mean/Proportion | Standard deviation | Minimum | Maximum |
Uncertainty Avoidance Index (UAI) | 69.5 | 20.1 | 35.0 | 99.0 |
Mathematics Performance Scale (MPS) | 502.0 | 15.0 | 481.0 | 526.0 |
Masculinity vs. Femininity Index (MAS) | 45.0 | 13.6 | 8.0 | 88.0 |
Size of the Shadow Economy (in the % of official GDP) | 16.5 | 6.4 | 7.1 | 27.0 |
Note that while testing the task complexity argument at the country level (model 1), we included only two country-level predictors that operationalised the complexity of the income question. Similarly, when verifying question sensitivity (model 2), we had only two country-level predictors that operationalised the sensitivity mechanism. In addition, when explaining differences in the odds of refusals vs ‘don’t know’ answers in model 3, we included only the country-level predictors that were significant in models 1 and 2, respectively. This decision was motivated by the limited number of countries in our analysis, which limited the number of country-level predictors that could be incorporated into the regression.
We controlled for the respondents’ gender, age and educational level, which previous studies have widely used in nonresponse analyses (e.g. Alexander, 2017; Montagni et al., 2019; Piekut, 2021). Gender was coded as 0 (woman) and 1 (man), while age was centred on a grand mean of 47.3. Education was measured using the International Standard Classification of Education (ISCED) and recoded into four categories: primary, incomplete secondary, ISCED 0–1; lower secondary, ISCED 2; upper secondary, ISCED 3 (we set up this as a reference category); and post-secondary, tertiary, ISCED 4–6.
At the interviewer level, we controlled for gender and age. The interviewer’s gender was indicated as 0 (woman) and 1 (man), while age was expressed in 10-year intervals (i.e. up to 30, 31–40, 41–50, 51–60, and 61 and older). Note that the ESS data do not contain information about the exact age of interviewers, and so we used age intervals as originally provided. In addition, there are no data on the interviewers’ educational level, so we could not add this as a control variable as we did for respondents. Descriptive statistics for interviewer-level data are included in Table B2 in the supplementary and replication materials.
Despite the ESS’ adherence to standardised sampling and fieldwork procedures to enable cross-national comparisons of the results, there is room for between-country differences in the sampling designs and fieldwork procedures (Fitzgerald & Jowell, 2010). This will affect survey outcomes, including income nonresponse (Silber & Johnson, 2020). Thus, in our analysis, we controlled for cross-survey variation in the level of income nonresponse by incorporating three survey-level characteristics derived from the ESS survey documentation reports. First, we chose the response rate (RR1 according to AAPOR, 2016), as previous research has found item nonresponse to be conditional on the response rate at a unit level (Loosveldt & Billiet, 2002; Yan & Curtin, 2010) and because response rates vary between countries and decrease over time (Jabkowski & Kołczyńska, 2020). Second, as some studies have demonstrated that interviewer experience affects the amount of nonresponse (Durrant et al., 2010; Hansen, 2007; Vercruyssen et al., 2017), we also controlled for the fraction of experienced interviewers (i.e. the number of interviewers with previous experience from working with the ESS divided by the total number of interviewers involved in the fieldwork execution in each national survey). Finally, as previous studies have found that involving interviewers in the sample selection decreases the overall survey quality (Eckman & Koch, 2019; Jabkowski & Cichocki, 2019; Menold, 2014), we also controlled whether it translates specifically into the occurrence of more satisficing behaviours among survey participants (here in the form of income nonresponses). We distinguished between individual and non-individual register samples. The latter takes the form of address-based or area probability samples requiring within-dwelling selection of target respondents as a part of fieldwork execution in the ESS (see Lynn et al., 2007). We combined them into one category of samples. We present descriptive statistics for survey-level data in Table B3 in the supplementary and replication materials.
All independent and control variables on the respondent and interviewer levels reached a maximum of 1.5 % of missing values (see Table 3), and thus we decided to use a complete case analysis. In total, we excluded 5390 cases (2.8 % of the total sample) with values missing in any of the defined variables, leaving 189,220 cases in the analysis.
Table 3 Distribution of item non-response cases across explanatory variables
Variables | Number of missing cases | Fraction of missing cases |
Source of income | 413 | 0.002 |
HH size (excluding children up to 14) | 782 | 0.004 |
Conservation (proxy of social desirability) | 184 | 0.001 |
Social trust index | 2749 | 0.015 |
Gender of the respondent | 0 | 0.000 |
Age of the respondent | 24 | < 0.001 |
Level of education | 491 | 0.003 |
Gender of the interviewer | 659 | 0.003 |
Age of the interviewer | 910 | 0.005 |
Total number of excluded cases | 5390 | 0.028 |
Total number of respondents included in analysis | 189,220 | – |
The dependent variable for the regression analysis (hereafter, INRijkl) had three outcomes, such that
is the probability of an answer being provided to the income question by respondent i being surveyed by interviewer j in country k and ESS round l;
is the probability of a ‘don’t know’ response; and
is the probability of a ‘refuse to say’ response. All analyses were conducted using the R software programme (R Core Team, 2018). We implemented the following packages for data manipulation and results visualisation: flextable (Gohel, 2021), haven (Wickham & Miller, 2022), labelled (Larmarange, 2021), lavaan (Rosseel, 2012), sjPlot (Lüdecke, 2021) and tidyverse (Wickham et al., 2019). Note that to estimate the cross-classified multilevel logistic regressions, we used the lme4 package (Bates et al., 2015). Due to technical limitations—the lmer4 package does not estimate the regression model in its multinomial form—we followed the recommendations of Becg and Gray (1984) and Silber et al. (2021) and formulated regressions as a set of three binary logistic models. Consequently, we separately predicted the log-odds of providing the ‘don’t know’ option vs ‘response’, i.e.
, and the log-odds of a refusal vs ‘response’, that is,
. Additionally, we estimated the log-odds of a refusal vs ‘don’t know’ option, that is,
, to contrast the two categories of nonresponding units. Note also that the lmer4 package only allows for estimating multilevel models with the integration points equal to 0 or 1 in the adaptive Gaussian-Hermite quadrature approximation of the log-likelihood (nAGQ)—when more than one random intercept is implemented (which was the case here)—and we used the default value of the nAGQ parameter (1). This decision means we estimated all models using the Laplacian approximation. Our assumed cross-classified model for ηijkl,c, where c = {1, 2, 3}, can be written as follows:
Where β0,c is the grand intercept, γjkl,c represents between-interviewer random intercepts, γk,c denotes between-country random intercepts, γl,c means between-round random intercepts, γ1k,c, γ3k,c and γ4k,c represent random components of the between-country variation in slopes for all level‑1 continuous covariates (i.e. household size, conservation and social trust index). β is a vector of regression coefficients on all independent variables. We assumed that the random effects are mutually independent and that they are normally distributed with a zero mean, such that
,
,
,
,
and
.
For each ηijkl,c, we estimated three different models: a null model, which did not contain any covariates; a random intercept model with fixed slopes, where
; and a random intercept model with random slopes, allowing both for the differences in the intercepts between the interviewers, countries and ESS rounds and the between-country variation in the regression coefficients for all continuous covariates, as presented in the model specification. In the Results section of this paper, we only present the null and cross-classified random effect models, while the results for the fixed slope models are included in the supplementary and replication materials in Tables B4, B5 and B6. Note, however, that there were no notable differences in the interpretation of the results of the regressions between the fixed- and random-slope models.
The null model allowed us to assess the size of the intraclass correlation coefficient (ICC) and estimate the proportion of variance between the interviewers, countries and ESS rounds. Note that the level‑1 residual variance in the logistic regression was scaled to 1.0 and could not be tested for statistical significance (Snijders & Bosker, 2011). Nevertheless, the variance of the logistic distribution with a scale factor of 1.0 was approximately equal to 3.29 or, more precisely, π2∕3 (Hox, Moerbeek & van de Schoot, 2010; Heck, Thomas, & Tabata, 2013), and the ICC for the ESS rounds, countries and interviewers could be expressed as follows:
It is important to note that the ICC values at the interviewer level are not easily interpretable because the respondents were not randomly assigned to the interviewers. Instead, interviewers were assigned to locally demarcated areas, which lowers the cost of fieldwork. Consequently, ICCint,c partially reflects area effects, which may be erroneously classified as interviewer effects. For this reason, some authors, such as Koen and Geert (2016), measured intra-interviewer variance, considering the area clustering. However, information on interviewer assignment to the primary sampling units (PSUs) is not publicly available in the ESS, and thus we could not use such information in our analysis.
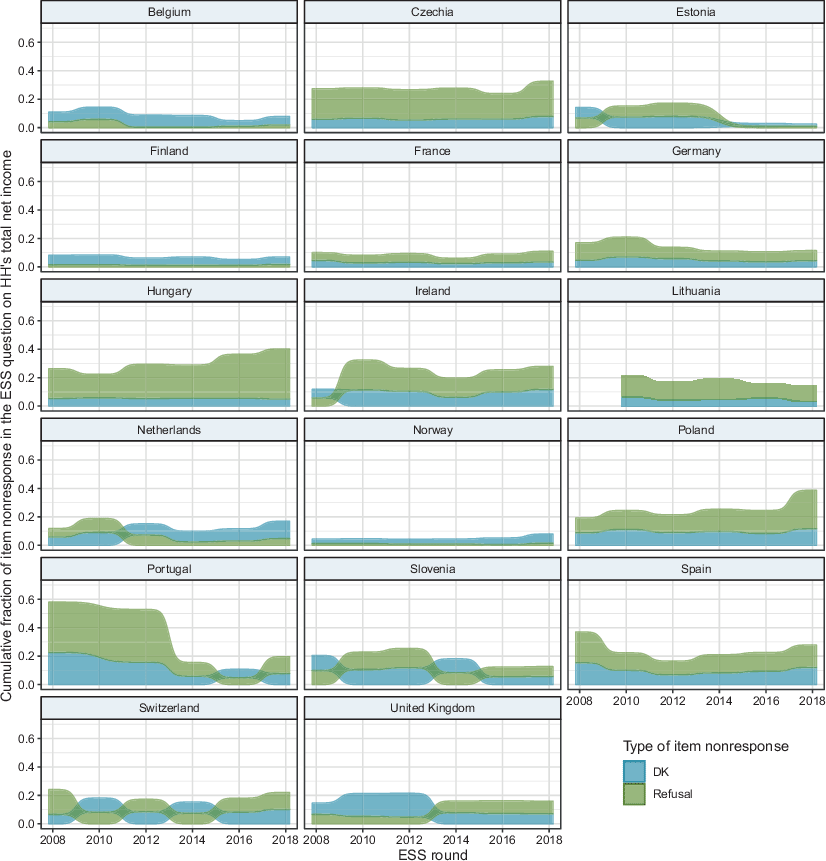
Fig. 1 displays how income nonresponse—both ‘don’t know’ and refusals as a cumulative percentage—changed over time across the study countries. Table B7 in the supplementary and replication materials provides detailed data on the distribution of item nonresponse in all countries and the ESS rounds under investigation, while Figure B3 demonstrates that the average fraction of item nonresponse was the highest for the income question across all core module questionnaire items in every ESS round from 4 to 9.
First, we observe a range of intensity in income nonresponse across the studied European countries between 2002 and 2018. There are a few countries in eastern and southern Europe where income nonresponse was very high (20–50% of a sample for a given round), while in many northern and western Europe countries, except Ireland, Switzerland and the UK, it was much lower and below 10%. However, the split is not very straightforward (e.g. east/west, south/north of Europe) when we look at the nonresponse type. The second pattern worth noting is that in some northern and western European countries (i.e. Belgium, Estonia, Finland, the Netherlands, Norway and the UK in 2010–2012) the percentage of ‘don’t know’ responses was systematically higher than that of refusals. This could suggest that income nonresponse in these countries is more often related to the task complexity mechanisms than the question sensitivity argument. In contrast, in Czechia, Hungary and more recently in Poland, the share of the ‘refuse to say’ option was quite high, exceeding that of ‘don’t know’ responses (i.e. in ESS round 9: 25% vs 8%, 35% vs 5% and 27% vs 12%, respectively) in the latest round of the ESS. Refusals were also more common in France, Germany, Lithuania, Portugal and Spain, with a more even split in nonresponse type in Slovenia and Switzerland.
With regard to the changes in income nonresponse over time, in some ESS countries, such as Portugal, Slovenia and Spain—which had fairly high item nonresponse initially—the percentage of respondents who did not reply to the income question substantially declined. In turn, in other countries, especially in Hungary and Poland, ‘refuse to say’ responses became more common, with overall income nonresponse reaching over 40% in both countries in ESS round 9.
We start by discussing the ICCs derived from the null model (which excludes all independent variables from the regression) to assess the amount of variance attributed to the respondents, interviewers, ESS rounds and countries. Subsequently, we analyse the individual-level patterns of income nonresponse, verifying whether (1) task complexity increases the probability of ‘don’t know’ answers and (2) question sensitivity increases the probability of ‘refuse to say’ answers first at the respondent level and then at the country level. Finally, we briefly discuss the results for the control variables at the individual and survey levels.
The random effects derived from the null models suggest that most of the variation occurred at the interviewer level (see Table B8 in the supplementary and replication materials). Across all models, the intraclass correlation at the interviewer level was above 0.30 (ICCint; DK = 0.313, ICCint; REF = 0.330 and ICCint; REF_DK = 0.317), indicating that one-third of the variance in income nonresponse propensity can be attributed to this data level. Meanwhile, at the country level, ICC values ranged from 0.05 for ‘don’t know’ answers to 0.19 for refusals (ICCcntr; DK = 0.047, ICCcntr; REF = 0.188 and ICCcntr; REF_DK = 0.177). ESS round-level ICC values were quite low compared to the interviewer and country levels (ICCESS round; DK = 0.006, ICCESS round; REF = 0.006 and ICCESS round; REF_DK = 0.002). Note, however, that the size of the variability was statistically significant for interviewers, countries and ESS rounds (at the level of significance equal to at least 0.01), as indicated by a likelihood ratio test (Morrel, 1998) comparing the log-likelihood of a null model with all random effects included in the log-likelihood of the reduced null model, that is, the model with random effects for interviewers, countries and ESS rounds removed, respectively. The likelihood ratio test results are presented in the supplementary and replication materials in section B8.1.
Two main conclusions can be drawn from the results of our analysis. First, the interviewer level plays a significant role in explaining the likelihood of obtaining income nonresponse options, which might be a consequence of the interviewer’s role when coding the two income nonresponse options. However, even if the instruction for the interviewers explicitly forbids them to read out the nonresponse answers, they might still decide on the wording used by a respondent whether ‘don’t know’ or ‘refuse to answer’ is more accurate. Second, when answering income questions, cross-country differences in the likelihood of ‘refuse to say’ answers are much higher than in the likelihood of providing ‘don’t know’ answers. The latter means that the sensitivity mechanism—associated with cultural norms around privacy and financial affairs—seems to be much more important at the country level than task complexity-related issues.
These findings of the null models are in alignment with previous results on item nonresponse, indicating that the interviewers contribute much more to variation in item nonresponse than other data nesting levels (Silber et al., 2021, Purdam et al., 2020). Nevertheless, contrary to Silber et al. (2021), who found that respondents’ decision to refuse to answer was much more influenced by interviewers than their decision to return ‘don’t know’ answers, our analyses demonstrate a similar impact of interviewers on both income nonresponse options. Still, there may be distinct mechanisms underlying the decision to provide ‘refuse to say’ and ‘don’t know’ answers, which we hypothesised to be associated with question sensitivity and task complexity, respectively.
Next, we investigate the task complexity and question sensitivity arguments by considering the individual-level covariates of income nonresponse. Table 4 shows the results of three multilevel logistic regressions (the models assume random intercepts across interviewers, countries and ESS rounds and random slopes across countries), predicting the probability of the occurrence of ‘don’t know’ and ‘refuse to say’ answers. We compared both groups of nonresponding units with those who answered the income question (models 1 and 2 in Table 4, respectively) and estimated the likelihood of giving a ‘refuse to say’ compared to a ‘don’t know’ answer (model 3 in Table 4).
Table 4 Summary of multi-level regression for random slopes models
Predictors | Model 1: ‘Don’t know’ vs. Response | Model 2: Refusal vs. Response | Model 3: Refusal vs. ’Don’t know | |||
OR | SE | OR | SE | OR | SE | |
OR odds ratios; SE standard errors of OR *p < 0.05, **p < 0.01, ***p < 0.001 | ||||||
Intercept | 0.02*** | 0.006 | 0.01*** | 0.003 | 0.24** | 0.110 |
Respondent-level predictors | ||||||
HH size (excluding children up to 14) | 1.75*** | 0.046 | 1.08*** | 0.022 | 0.57*** | 0.015 |
Source of income [Wages or salaries] | Ref | Ref | Ref | |||
– Pensions | 2.46*** | 0.101 | 0.88*** | 0.030 | 0.44*** | 0.029 |
– Unemployment or any other social benefits | 0.71*** | 0.038 | 0.58*** | 0.035 | 0.73** | 0.077 |
– Income from investments, savings or other | 3.88*** | 0.523 | 1.72*** | 0.210 | 0.47** | 0.111 |
– Income from self-employment or farming | 2.12*** | 0.078 | 1.48*** | 0.054 | 0.59*** | 0.036 |
– ‘Do not know’ | 21.91*** | 1.966 | 1.95*** | 0.245 | 0.11*** | 0.015 |
– Refusal | 8.48*** | 2.190 | 108.83*** | 15.010 | 30.70*** | 5.752 |
Conservation (proxy of social desirability) | 0.97 | 0.021 | 1.02 | 0.045 | 1.07 | 0.044 |
Social trust index | 1.03 | 0.017 | 0.85*** | 0.017 | 0.86*** | 0.035 |
Respondent-level control variables | ||||||
Gender of the respondent [female] | Ref | Ref | Ref | |||
– Male | 0.70*** | 0.016 | 0.87*** | 0.019 | 1.36*** | 0.054 |
Age of the respondent | 0.95*** | 0.001 | 1.01*** | 0.001 | 1.06*** | 0.002 |
Education [Upper secondary ISCED 3] | Ref | Ref | Ref | |||
– Less than lower secondary education (ISCED 0–1) | 3.17*** | 0.122 | 1.12** | 0.044 | 0.40*** | 0.027 |
– Lower secondary education completed (ISCED 2) | 2.00*** | 0.061 | 1.00 | 0.031 | 0.52*** | 0.027 |
– Post-secondary education completed (ISCED 4–6) | 0.67*** | 0.022 | 1.09** | 0.030 | 1.79*** | 0.097 |
Interviewer-level control variables | ||||||
Gender of the interviewer [female] | Ref | Ref | Ref | |||
– Male | 0.83*** | 0.039 | 0.83*** | 0.039 | 1.12 | 0.075 |
Age of the interviewer [Up to 30 years old] | Ref | Ref | Ref | |||
– 31–40 years old | 1.08 | 0.130 | 1.34* | 0.154 | 1.44* | 0.239 |
– 41–50 years old | 1.19 | 0.133 | 1.35** | 0.145 | 1.37* | 0.212 |
– 51–60 years old | 1.25* | 0.136 | 1.10 | 0.116 | 1.08 | 0.163 |
– 61 and older | 1.12 | 0.125 | 1.04 | 0.113 | 1.11 | 0.172 |
Survey characteristics | ||||||
Response rate (RR1) | 4.39*** | 1.698 | 2.41* | 1.043 | 0.67 | 0.402 |
Fraction of experienced interviewers | 1.67*** | 0.201 | 1.46** | 0.184 | 1.09 | 0.186 |
Within household selection performed by the interviewers [Yes = 1] | 1.77*** | 0.181 | 1.35* | 0.182 | 0.83 | 0.152 |
Country-level predictors | ||||||
Uncertainty Avoidance Index (UAI) | 0.99** | 0.003 | – | – | 1.01 | 0.012 |
Mathematics Performance Scale (MPS) | 1.00 | 0.006 | – | – | – | – |
Masculinity vs. Femininity Index (MAS) | – | – | 1.04*** | 0.010 | 1.02* | 0.011 |
Size of the Shadow Economy (in the % of official GDP) | – | – | 1.09** | 0.033 | 1.09** | 0.035 |
Model summary | ||||||
Number of interviewers | 13,285 | 13,427 | 8650 | |||
Number of countries | 17 | 17 | 17 | |||
Number of ESS rounds | 6 | 6 | 6 | |||
Number of respondents | 164,406 | 170,522 | 32,732 | |||
Model fits statistics | ||||||
AIC | 66,882.04 | 76,734.71 | 26,840.95 | |||
Log-Likelihood | −33,404.02 | −38,330.36 | −13,382.48 | |||
We explore H1 on task complexity by looking at the results for the two independent variables: household size (excluding children up to 14) and main source of income. The conclusions are mixed when analysing the first two columns presented in Table 1 (models 1 and 2). As we expected, a ‘don’t know’ income nonresponse was more likely among respondents living in larger households. However, contrary to our expectation, we also found that ‘refuse to say’ responses were more likely to be associated with larger households. This result means that household size increases the probability of missing values, regardless of their type. However, when looking at the third model contrasting the two types of nonresponses, refusals and ‘don’t know’ answers, we find support for H1a. Among nonresponding units, those living in larger households were significantly more likely to say ‘don’t know’ than to refuse to answer the income question.
Our results were also mixed concerning the impact of the primary source of household income on the difficulty in reporting a household’s total net income. Regarding the evidence supporting H1b stating that more ‘don’t knows’ will be associated with respondents with less stable sources of income in comparison to respondents whose household income comes from wages or salaries, a ‘don’t know’ income nonresponse was more common among respondents whose households mostly relied on income from self-employment, farming, investments, savings or other sources. While the wages or salaries are more likely to be regular and have fixed values, income sources in the latter group can be irregular and vary in value. In contrast, but still in line with the task complexity argument, respondents whose primary source of household income was welfare benefits—whose value is least likely to change over time—had an even lower probability of providing a ‘don’t know’ response than those depending mainly on wages and salaries. Contrary to what we expected, compared to the reference category of respondents, the probability of reporting ‘don’t know’ was higher among those whose main source of income was pensions. This is interesting, as state pensions usually take the form of a fixed and regular monthly payment.
Not surprisingly, the highest odds of income nonresponse were among respondents who also did not reply to the question about the main source of income. The odds were almost three times higher among those who stated they did not know their source of income than among those who refused to answer the question. However, in model 2 predicting refusals, the odds of income nonresponse were 57 times higher among those who had also refused to answer the question about income source than among those who replied ‘don’t know’.
We also found some other similarities in nonresponse between the models for ‘don’t know’ (model 1) and ‘refuse to say’ (model 2) as well as for ‘refuse to say’ vs ‘don’t know’ (model 3) across the categories measuring the primary source of income. Respondents whose main source of income was from investments, savings or other sources or self-employment or farming were more prone to reply ‘don’t know’ or ‘refuse to answer’. This indicates that the source of income is correlated with both task complexity and question sensitivity. However, when only nonresponders were compared, the pattern for ‘don’t know’ responses was stronger.
The second hypothesis relates to the question sensitivity argument. One of two individual-level covariates in our analytical model 2 on question sensitivity was in line with our expectations. We expected that respondents who scored higher on the scale measuring conservation (a proxy of social desirability) values would be more likely to refuse to answer the income question (H2b). However, the coefficient was not statistically significant. Even so, those with higher social trust were less likely to refuse to answer the income question (H2a). Importantly, both factors were not statistically significant for the model predicting the probability of ‘don’t know’ responses (model 1). Additionally, in line with H2a, among nonresponding units, those with lower social trust were more likely to opt for refusal than to reply ‘don’t know’ (model 3).
Moving on to the differences between countries and the task complexity argument (model 1), adult numeracy skills operationalised using PISA mathematics performance score were not statistically significant (H3a). However, the odds of ‘don’t know’ nonresponse were lower in countries with a higher uncertainty avoidance index (UAI), confirming H3b. In other words, higher UAI correlates with a higher likelihood of providing a response to the income question. At the same time, UAI had a negligible effect in terms of explaining cross-country differences in the odds of refusal vs ‘don’t know’ answer (model 3).
Regarding the question sensitivity argument (model 2), both country-level indicators were statistically significant and in line with H4: respondents living in countries with a more masculine culture and larger shadow economy, where more income is not reported to tax authorities, are more likely to refuse to answer the income question in the ESS survey. The association remained significant in model 3, providing additional support for H4.
While age, gender and education were not our main points of interest, they might be related to the studied mechanisms and worth noting. Minding the interviewer effect, as in the case of other types of nonresponse (Herda, 2013; Piekut, 2021), women are more likely not to respond either by replying ‘don’t know’ or refusing to answer (or their interviewers are keener to select it), but among nonrespondents, men are more likely to opt for refusals instead of admitting a lack of knowledge (if that was the case). As such, the task complexity mechanism is stronger among women, while question sensitivity is stronger among men. This could be explained by the dominance of hegemonic masculine cultures in many European countries, which confer power in household decision-making to men (Cahusac & Kanji, 2014). Income nonresponse in the form of refusals indicates that the fear of disapproval of low earnings is stronger among men (Schräpler, 2006). Younger respondents are more likely to reply ‘don’t know’, while older respondents are more likely to refuse to answer. Regarding interviewer characteristics, female interviewers receive more nonresponses of both types. This could mean that women either accept nonresponses more than men or that in some cultures noncooperative respondents find it easier not to answer survey questions when interviewed by a woman (Schräpler, 2004). Middle-aged interviewers, that is 31–50 years of age, record more refusals in comparison to younger interviewers. More educated respondents are likely to have higher statistical literacy, which would help in calculating their net household total income (Berinsky, 2002). In comparison to middle-educated (ISCED 3) respondents, those with tertiary education were less likely to reply ‘don’t know’ to the income question but more likely to refuse to answer it. Thus, while the question posed less cognitive difficulty for them, it also might have been a more sensitive topic for highly educated respondents compared to others (or they preferred not to admit their lack of knowledge).
Finally, while some survey-related characteristics correspond with the nonresponse propensity, they follow the same pattern for ‘don’t know’ and refusals (no significant differences in model 3). More income nonresponse occurred in surveys that achieved a higher overall unit response rate and which had interviewers who were more experienced and played a greater role in the respondent selection process. First, this result echoes previous findings demonstrating the positive association between item nonresponse and the unit response rate, which supports the presumption that surveys with higher response rates include more reluctant respondents who are less motivated to participate (Yan & Curtin, 2010). Second, our results also align with analyses showing that surveys that involve interviewers in the selection process recruit more satisficing respondents (Menold, 2014; Eckman & Koch, 2019; Jabkowski & Cichocki, 2019). Even more important from the perspective of the scope of this study is the role of interviewers in shaping the interview dynamic. While more experience among interviewers has often been associated with lower unit nonresponse (West & Blom, 2017), our results indicate that more experienced interviewer teams might create an environment favouring time and resource effectiveness and indirectly resulting in higher item nonresponse when sensitive questions and those demanding more cognitive effort are asked.
Our analysis, based on ESS rounds 4–9, revealed that nonresponse to the question about a household’s total net income is patterned by two mechanisms. We found support for the task complexity argument; the income question is particularly cognitively challenging due to the respondents’ household size and income situations. We hypothesized that respondents who live in larger households and whose primary source of income does not come from a stable source are more likely to provide ‘don’t know’ responses. We found that respondents living in larger households (H1a) and in households whose primary income source is not a regular wage, pension or benefit are more likely to reply ‘don’t know’ (H1b). We also found evidence favouring one mechanism in the sensitivity argument, demonstrating that social desirability and reservations about revealing sensitive information are other important determinants of income nonresponse; the odds of refusing to answer are higher for respondents who trust other people less (H2a). However, we did not find confirmation that conservation values will correlate in a higher probability of refusals (H2b).
The results have implications for understanding the framework of ‘survey satisficing’, according to which respondents’ likelihood of responding to a question depends on their ability and motivation to answer and the task difficulty (Krosnick, 1991). On the one hand, the findings demonstrate that the survey response process—consisting of question understanding, information retrieval, estimation and judgement and, finally, fitting into the response category (Beaty & Herrmann, 2002)—varies for those who reply ‘don’t know’ and ‘refuse to say’. In the former case, problems arise when information about household income must be retrieved and making calculations turns out to be impossible or too difficult during an interview. In turn, respondents who refuse to answer decide not to disclose sensitive information when assimilating the question. Here, the satisficing process is stronger, as respondents do not perform much or any memory search to answer the question due to question sensitivity. On the other hand, some patterns we argued would apply only to ‘don’t know’ responses were, to some extent, also seen in ‘refuse to say’ responses, such as household size and income source. This could mean that ‘don’t knowers’ and ‘refusers’ are not always two different populations, as argued previously (Schräpler, 2006; Shoemaker et al., 2002). Rather, similar respondents might hesitate to formulate an answer due to task complexity and too much cognitive effort, and they might also feel the income question is too sensitive to answer. Another explanation might be related to the process of recording nonresponses during an interview: respondents might purposefully switch between the two nonresponse options (e.g. wishing to hide a lack of knowledge and instead opting for refusal) or select an incorrect nonresponse option unintentionally (e.g. replying ‘don’t know’ and not being aware that refusing to answer is another available nonresponse option). Another possibility could be associated with the role of interviewers when coding the nonresponse option. If respondents are hesitating for too long, interviewers might not follow the guidance on not reading out the nonresponse options and instead suggest one of them to a respondent—either ‘don’t know’ or ‘refuse to answer’—or choose the final nonresponse answer for them. In other words, ‘don’t knowers’ and ‘refusers’ are similar because data might not always be recorded consistently. Finally, if some of interviewer effects might overlap with area effects if they are assigned to interview a cluster of respondents living in the same location (Friedel, 2020).
Furthermore, our study indicates that a respondent’s motivation and ability to answer are not solely an individual-level factor but also vary across countries and are correlated with selected country-level characteristics linked with both mechanisms. We expected that the likelihood of ‘don’t know’ responses would be higher in countries with lower adult numeracy skills (H3a), and (2) lower when the respondent lives in a country with higher uncertainty avoidance (H3b). We did not find support for the first claim, but indeed the propensity to respond ‘don’t know’ is lower in national contexts where uncertainty is avoided more, so during interviews respondents feel more inclined to answer the question, possibly even if they are not completely sure about their household income. Hence, lower income nonresponse might be related to higher measurement error for that question in such countries. We expected a higher likelihood of ‘refuse to say’ responses in countries where income misreporting is more common (H4a), and among respondents who live in countries with higher masculinity values (H4b). We find support for both claims. The income question is more sensitive in countries where gender roles are more distinct and masculinity is connected with material success as well as where more income is not reported to tax authorities so involvement in unreported employment is more common. Income nonresponse has decreased over time in many European countries, partially due to survey consolidation and improvements in survey management. However, it this has not been the case in some countries like Hungary and Poland, which still have high income nonresponse rates. Further analysis of how the ESS is implemented locally could reveal the reasons for this disparity.
Our analyses allow us to conclude with some recommendations for survey practitioners. When surveying larger households, it is more likely that the interviewed person will not know all sources and amounts of household income. This possibility was confirmed by our analysis of survey characteristics, including different sampling procedures applied on the ground. Income nonresponse—especially ‘don’t know’ responses—occurs more often when interviewers perform the respondent selection, for example, by selecting a person with greater availability at a given time. The implication of this finding is simple—for household questions about subjects like income, it seems reasonable to allow the respondent to liaise with more knowledgeable household members and ask them about the total household income.
Survey companies should also consider procedures that reduce task complexity and respondents’ motivation to not respond through impression management. More clarification and comprehensive instructions do not necessarily decrease the nonresponse rate (Küfner et al., 2021). As such, instead of asking one complex question, potentially with overly long instructions, it might be better to improve accessibility by splitting the question into a few, easier-to-grasp, tasks. Respondents could be offered a list of various household sources of income and provide an estimate separately for each source. In this way, they would be given more time to reflect on each source and be reminded about them, and they would not need to make the final calculations themselves. These composite incomes would not be recorded to not increase sensitivity by revealing too much detailed information about income sources.
However, changing the question design and wording is not the best strategy for increasing responses among participants who do not engage cognitively in answering the question due to its sensitivity. The ESS tries to minimise income question sensitivity by giving the respondent disordered letters as answer categories. Nevertheless, the respondent might be convinced that the interviewer knows the income deciles lying behind the letters. Thus, the apparent recommendation for reducing social desirability for an income question is to make the income section of the questionnaire self-administered or to generate different random letters for each respondent corresponding to income brackets (and reveal it to respondents), which could only be decoded by the respondent and the fieldwork agency, never the interviewer. In countries in which the income question is considered more sensitive, respondents might be reminded that the information provided in surveys is never shared with any authorities. Further, for a question asking the respondent to list all income sources, as described above, vague wording, such as ‘another source’, could be used to describe various sources of casual income and income from unreported employment.
Finally, analyses of item nonresponse in cross-national surveys like the ESS could be facilitated by measuring cultural values (e.g. uncertainty avoidance) and attitudes conditioning the propensity to satisfice, which often vary across countries. While we used conformity from the Schwartz scale as a proxy for social desirability bias, it would be beneficial for further methodological studies to employ more direct measures linked with the respondents’ cognitive effort during the interview and attitudes towards sharing personal information.
Our study has several limitations. We focused on one European survey—the ESS—and it would be insightful to replicate/extend the analysis using other large-scale surveys, both from Europe and other regions of the world. Since the income question is measured differently across surveys, conducting a cross-project study would be necessary to account for differences in how the question is operationalised and worded. Furthermore, during the Covid-19 pandemic, many cross-national surveys moved online (e.g. Luijkx et al., 2021)—which might reduce social desirability reporting—offering an opportunity to include the survey mode as another explanatory factor.
Further research on income nonresponse in cross-national studies could incorporate the response continuum perspective and deal with the unit and item nonresponse together as a part of one cooperative survey process (Billiet et al., 2007; Yan & Curtin, 2010). We also found differences in income nonresponse between men and women respondents and interviewers, and this analysis could be extended by investigating whether the task complexity and question sensitivity mechanisms are gendered. Additionally, examining other country-related differences in nonresponse and various contextual effects (e.g. in national economies and cultures) would provide additional insights into nonresponse mechanisms in survey-based income measurements.
This work was supported by a grant awarded by the National Science Centre, Poland (no. 2018/31/B/HS6/00403).
Achim, M. V., Borlea, S. N., Găban, L. V., & Mihăilă, A. A. (2019). The shadow economy and culture: evidence in European countries. Eastern European Economics, 57, 352–374. →
Alexander, E. C. (2017). Don’t know or won’t say? Exploring how colorblind norms shape item nonresponse in social surveys. Sociology of Race and Ethnicity, 4, 417–433. https://doi.org/10.1177/2332649217705145. →
Alwin, D. F., & Krosnick, J. A. (1991). The reliability of survey attitude measurement: the influence of question and respondent attributes. Sociological Methods & Research, 20, 139–181. →
American Association for Public Opinion Research (2016). Standard definitions: Final dispositions of casecodes and outcome rates for surveys. 9th edition. https://www.aapor.org/AAPOR_Main/media/publications/Standard-Definitions20169theditionfinal.pdf →
Bates, D., Mächler, M., Bolker, B., & Walker, S. (2015). Fitting linear mixed-effects models using lme4. Journal of Statistical Software, 67, 1–48. →
Beatty, P., & Herrmann, D. (2002). To answer or not to answer: decision processes related to survey item nonresponse. In R. M. Groves, D. A. Dillman, J. L. Eltinge & R. J. A. Little (Eds.), Survey nonresponse. Wiley. a, b
Becg, C. B., & Gray, R. (1984). Calculation of polychotomous logistic regression parameters using individualized regressions. Biometrika, 71, 11–18. →
Berinsky, A. J. (2002). Silent voices: social welfare policy opinions and political equality in america. American Journal of Political Science, 46, 276–287. →
Beullens, K., Loosveldt, G., Vandenplas, C., & Stoop, I. (2018). Response rates in the European Social Survey: Increasing, decreasing, or a matter of fieldwork efforts? In Survey methods: insights from the field (pp. 1–12). →
Billiet, J., Philippens, M., Fitzgerald, R., & Stoop, I. (2007). Estimation of nonresponse bias in the European social survey: using information from reluctant respondents. Journal of Official Statistics, 23, 135–162. a, b
Cahusac, E., & Kanji, S. (2014). Giving up: how gendered organizational cultures push mothers out. Gender. Work and Organization, 21(1), 57–70. →
Callens, M., & Loosveldt, G. (2018). Don’t know’ responses to survey items on trust in police and criminal courts: a word of caution. In Survey methods: insights from the field (pp. 1–11). →
Chen, F. F. (2007). Sensitivity of goodness of fit indexes to lack of measurement invariance. Structural Equation Modeling: A Multidisciplinary Journal, 14(3), 464–504. →
Converse, J. M. (1976). Predicting no opinion in the polls. Public Opinion Quarterly, 40, 515–530. a, b
Cornesse, C., & Blom, A. G. (2020). Response quality in Nonprobability and probability-based online panels. Sociological Methods & Research, 52, 879–908. →
Daniele, G., & Geys, B. (2015). Interpersonal trust and welfare state support. European Journal of Political Economy, 39, 1–12. →
Davidov, E. (2008). A cross-country and cross-time comparison of the human values measurements with the second round of the European Social Survey. Survey Research Methods, 2, 33–46. →
D’Hernoncourt, J., & Méon, P.-G. (2012). The not so dark side of trust: does trust increase the size of the shadow economy? Journal of Economic Behavior & Organization, 81, 97–121. →
Durrant, G. B., Groves, R. M., Staetsky, L., & Steele, F. (2010). Effects of interviewer attitudes and behaviors on refusal in household surveys. Public Opinion Quarterly, 74(1), 1–36. →
Eckman, S., & Koch, A. (2019). Interviewer involvement in sample selection shapes the relationship between response rates and data quality. Public Opinion Quarterly, 83, 313–337. a, b, c
ESS (2008). European Social Survey Round 4 Data. Data file edition 4.5. Sikt—Norwegian Agency for Shared Services in Education and Research, Norway—Data Archive and distributor of ESS data for ESS ERIC. https://doi.org/10.21338/NSD-ESS4-2008. →
ESS (2010). European Social Survey Round 5 Data. Data file edition 3.4. Sikt—Norwegian Agency for Shared Services in Education and Research, Norway—Data Archive and distributor of ESS data for ESS ERIC. https://doi.org/10.21338/NSD-ESS5-2010. →
ESS (2012). European Social Survey Round 6 Data. Data file edition 2.4. Sikt—Norwegian Agency for Shared Services in Education and Research, Norway—Data Archive and distributor of ESS data for ESS ERIC. https://doi.org/10.21338/NSD-ESS6-2012. →
ESS (2014). European Social Survey Round 7 Data (2014). Data file edition 2.2. Sikt—Norwegian Agency for Shared Services in Education and Research, Norway—Data Archive and distributor of ESS data for ESS ERIC. https://doi.org/10.21338/NSD-ESS7-2014. →
ESS (2016). European Social Survey Round 8 Data (2016). Data file edition 2.2. Sikt—Norwegian Agency for Shared Services in Education and Research, Norway—Data Archive and distributor of ESS data for ESS ERIC. https://doi.org/10.21338/NSD-ESS8-2016. →
ESS (2018a). ESS‑4 2008 Documentation Report. Edition 5.5. Bergen, European Social Survey Data Archive, Sikt—Norwegian Agency for Shared Services in Education and Research, Norway for ESS ERIC →
ESS (2018b). ESS‑5 2010 Documentation Report. Edition 4.2. Bergen, European Social Survey Data Archive, Sikt—Norwegian Agency for Shared Services in Education and Research, Norway for ESS ERIC
ESS (2018c). ESS‑6 2012 Documentation Report. Edition 2.4. Bergen, European Social Survey Data Archive, Sikt—Norwegian Agency for Shared Services in Education and Research, Norway for ESS ERIC
ESS (2018d). ESS‑7 2014 Documentation Report. Edition 3.2. Bergen, European Social Survey Data Archive, Sikt—Norwegian Agency for Shared Services in Education and Research, Norway for ESS ERIC
ESS (2018e). European Social Survey Round 9 Data. Data file edition 3.1. Sikt—Norwegian Agency for Shared Services in Education and Research, Norway—Data Archive and distributor of ESS data for ESS ERIC. https://doi.org/10.21338/NSD-ESS9-2018. →
ESS (2018f). European Social Survey Round 9 Interviewer Briefing: Interviewer Manual. London: ESS ERIC Headquarters. https://stessrelpubprodwe.blob.core.windows.net/data/round9/fieldwork/source/ESS9_project_instructions.zip →
ESS (2018g). ESS Round 9 Source Questionnaire. Bergen, European Social Survey Data Archive, NSD—Norwegian Centre for Research Data for ESS ERIC. https://www.europeansocialsurvey.org/docs/round9/fieldwork/source/ESS9_source_questionnaires.pdf →
ESS (2020). ESS‑8 2016 Documentation Report. Edition 2.2. Bergen, European Social Survey Data Archive, Sikt—Norwegian Agency for Shared Services in Education and Research, Norway for ESS ERIC →
ESS (2021). ESS‑9 2018 Documentation Report. Edition 3.1. Bergen, European Social Survey Data Archive, Sikt—Norwegian Agency for Shared Services in Education and Research, Norway for ESS ERIC →
Fitzgerald, R. (2015). Sailing in unchartered waters: Structuring and documenting cross-national questionnaire design. GESIS Papers 2015/05. (pp. 1–24). a, b
Fitzgerald, R., & Jowell, R. (2010). Measurement equivalence in comparative surveys: the European Social Survey (ESS)—From design to implementation and beyond. In J. A. Harkness (Ed.), Survey methods in multinational, multiregional, and multicultural contexts. Wiley. a, b
Frick, J. R., & Grabka, M. M. (2014). Missing income data in the German SOEP: Incidence, imputation and its impact on the income distribution. SOEP Survey Papers No. 225. a, b
Friedel, S. (2020). What they expect is what you get: the role of interviewer expectations in nonresponse to income and asset questions. Journal of Survey Statistics and Methodology, 8, 851–876. →
Geiger, M. A., O’Connell, B. T., Clikeman, P. M., Ochoa, E., Witkowski, K., & Basioudis, I. (2006). Perceptions of earnings management: the effects of national culture. Advances in International Accounting, 19, 175–199. →
Gohel, D. (2021). flextable: Functions for Tabular Reporting. R package version 0.6.9. https://CRAN.R-project.org/package=flextable →
Hansen, K. M. (2007). The effects of incentives, interview length, and interviewer characteristics on response rates in a CATI-study. International Journal of Public Opinion Research, 19(1), 112–121. →
Hansen, K., & Kneale, D. (2013). Does how you measure income make a difference to measuring poverty? Evidence from the UK. Social Indicators Research, 110, 1119–1140. a, b, c
Hariri, J. G., & Lassen, D. D. (2017). Income and outcomes. Social desirability bias distorts measurements of the relationship between income and political behavior. Public Opinion Quarterly, 81, 564–576. a, b, c
Heck, R., Thomas, H. S., & Tabata, L. (2013). Multilevel modeling of categorical outcomes using IBM SPSS. Routledge. →
Herda, D. (2013). Too many immigrants? Examining alternative forms of immigrant population innumeracy. Sociological Perspectives, 56, 213–240. a, b, c
Hofstede, G., & Bond, M. H. (1984). Hofstede’s culture dimensions: an independent validation using Rokeach’s value survey. Journal of Cross-Cultural Psychology, 15(4), 417–433. a, b
Hofstede, G., Hofstede, J., & Minkov, M. (2010). Cultures and organizations: software of the mind (3rd edn.). McGraw-Hill. →
Hox, J. J., Moerbeek, M., & van de Schoot, R. (2010). Multilevel analysis: techniques and applications. Routledge. →
Hu, L., & Bentler, P. P. (1999). Cutoff criteria for fit indexes in covariance structure analysis: conventional criteria versus new alternatives. Structural Equation Modeling: A Multidisciplinary Journal, 6(1), 1–55. →
Hurst, E., Li, G., & Pugsley, B. (2014). Are household surveys like tax forms? Evidence from income underreporting of the self-employed. The Review of Economics and Statistics, 96, 19–33. →
Jabkowski, P., & Cichocki, P. (2019). Within-household selection of target-respondents impairs demographic representativeness of probabilistic samples: evidence from seven rounds of the European Social Survey. Survey Research Methods, 13(2), 167–180. a, b
Jabkowski, P., & Kołczyńska, M. (2020). Sampling and fieldwork practices in Europe: analysis of methodological documentation from 1,537 surveys in five cross-national projects, 1981–2017. Methodology, 16(3), 186–207. →
Jabkowski, P., & Piekut, A. (2023). Not random and not Ignorable. An examination of Nonresponse to income question in the European social survey, 2008–2018. Field Methods. https://doi.org/10.1177/1525822X23119417 →
Johnson, T. P., O’Rourke, D., Burris, J., & Owens, L. (2002). Culture and survey nonresponse. In R. M. Groves, D. A. Dillman, J. L. Eltinge & R. J. A. Little (Eds.), Survey nonresponse (pp. 55–70). New York: Wiley. a, b
Johnson, T. P., Cho, Y. I., & Lee, G. (2010). Examining the association between cultural environments and survey nonresponse. Survey Practice, 3, 1–14. a, b
Johnson, T. P., Pennell, B.-E., Stoop, I., & Dorer, B. (2018). Advances in comparative survey methods: multinational, multiregional, and multicultural contexts (3MC). Wiley. →
Kaminska, O., & Lynn, P. (2017). Survey-based cross-country comparisons where countries vary in sample design: issues and solutions. Journal of Official Statistics, 33, 123–136. →
Kaminska, O., McCutcheon, A. L., & Billiet, J. (2010). Satisficing among reluctant respondents in a crossnational context. Public Opinion Quarterly, 74(5), 956–984. →
Kim, J., Son, K., Kwok, P. K., Kang, J.-H., Laken, F., Daquilanea, J., & Smith, T. W. (2015). Trends and correlates of income nonresponse: forty years of the US general social survey (GSS). Journal of Korean Official Statistics, 20, 1–23. →
Klíma, O., Lakomý, M., & Volevach, E. (2023). Impacts of cultural factors and mode of administration on item nonresponse for political questions in the European context. International Journal of Social Research Methodology. a, b, c
Koch, A., & Blohm, M. (2009). Item non-response in the European Social Survey. Ask Research & Methods, 18, 45–65. a, b, c, d
Koen, B., & Geert, L. (2016). Interviewer effects in the European social survey. Survey Research Methods, 10(2), 103–118. →
Kolarz, P., Angelis, J., Krčál, A., Simmonds, P., Traag, V., Wain, M., & Zuijdan, F. (2017). Comparative impact study of the European Social Survey (ESS) ERIC. Technopolis Group. →
Korinek, A., Mistiaen, J. A., & Ravallion, M. (2006). Survey nonresponse and the distribution of income. The Journal of Economic Inequality, 4, 33–55. →
Krosnick, J. A. (1991). Response strategies for coping with the cognitive demands of attitude measures in surveys. Applied Cognitive Psychology, 5, 213–236. a, b
Krosnick, J. A., Holbrook, A. L., Berent, M. K., Carson, R. T., Hanemann, W. M., Kopp, R. J., & Smith, V. K. (2002). The impact of ‘no opinion’ response options on data quality: Non-attitude reduction or an invitation to satisfice? Public Opinion Quarterly, 66, 371–403. →
Krumpal, I. (2013). Determinants of social desirability bias in sensitive surveys: a literature review. Quality & Quantity, 47, 2025–2047. a, b
Küfner, B., Sakshaug, J. W., & Zins, S. (2021). More clarification, less item nonresponse in establishment surveys? A split-ballot experiment. Survey Research Methods, 15(2), 195–206. →
Kuha, J., Butt, S., Katsikatsou, M., & Skinner, C. J. (2018). The effect of probing “Don’t know” responses on measurement quality and nonresponse in surveys. Journal of the American Statistical Association, 113(521), 26–40. →
Lahtinen, H., Martikainen, P., Mattila, M., Wass, H., & Rapeli, L. (2019). Do surveys overestimate or underestimate socioeconomic differences in voter turnout? Evidence from administrative registers. Public Opinion Quarterly, 83, 363–385. →
Larmarange, J. (2021). labelled: Manipulating Labelled Data. R package version 2.8.0. https://CRAN.R-project.org/package=labelled →
Lee, S., Liu, M., & Hu, M. (2017). Relationship between future time orientation and item nonresponse on subjective probability questions: a cross-cultural analysis. Journal of Cross-Cultural Psychology, 48(5), 698–717. a, b, c
Lelkes, O. (2006). Knowing What is good for you: Empirical analysis of personal preferences and the ‘objective good. The Journal of Socio-Economics, 35, 285–307. →
Locander, W. B., & Burton, J. P. (1976). The effect of question form on gathering income data by telephone. Journal of Marketing Research, 13, 189–192. →
Loosveldt, G., & Billiet, J. (2002). Item nonresponse as a predictor of unit nonresponse in a panel survey. Journal of Official Statistics, 18(4), 545–557. →
Lüdecke, D. (2021). sjPlot: Data visualization for statistics in social science. R package version 2.8.10”. https://strengejacke.github.io/sjPlot/ →
Luijkx, R., Jónsdóttir, G. A., Gummer, T., Stähli, E., Frederiksen, M., Ketola, K., & Wolf, C. (2021). The European Values Study 2017: On the way to the future using mixed-modes. European Sociological Review, 37(2), 330–346. →
Lynn, P., Jakle, A., Jenkins, S. P., & Sala, E. (2006). The effects of dependent interviewing on responses to questions on income sources. Journal of Official Statistics, 22, 357–384. a, b
Lynn, P., Häder, S., Gabler, S., & Laaksonen, S. (2007). Methods for achieving equivalence of samples in cross-national surveys: the European Social Survey experience. Journal of Official Statistics, 23, 107–124. a, b, c
Meitinger, K. M., & Johnson, T. P. (2020). Power, culture and item nonresponse in social surveys. In P. S. Brenner (Ed.), Understanding survey methodology: sociological theory and applications. Springer. a, b
Menold, N. (2014). The influence of sampling method and interviewers on sample realization in the European Social Survey. Survey Methodology, 40(1), 105. a, b
Meuleman, B., Abts, K., Schmidt, P., Pettigrew, T. F., & Davidov, E. (2020). Economic conditions, group relative deprivation and ethnic threat perceptions: a cross-national perspective. Journal of Ethnic and Migration Studies, 46, 593–611. →
Montagni, I., Cariou, T., Tzourio, C., & González-Caballero, J.-L. (2019). ‘I don’t know’, ‘I’m not sure’, ‘I don’t want to answer’: a latent class analysis explaining the informative value of nonresponse options in an online survey on youth health. International Journal of Social Research Methodology, 22, 651–667. →
Moore, J. C., & Loomis, L. (2002). Reducing income nonresponse in a topic-based interview. Survey Methodology, , 2002–2006. →
Morrell, C. H. (1998). Likelihood ratio testing of variance components in the linear mixed-effects model using restricted maximum likelihood. Biometrics, 54, 1560–1568. →
OECD (2023). Mathematics performance (PISA) (indicator). https://doi.org/10.1787/04711c74-en. →
Olson, K., Smyth, J. D., & Ganshert, A. (2019). The effects of respondent and question characteristics on respondent answering behaviors in telephone interviews. Journal of Survey Statistics and Methodology, 7(2), 275–308. →
Piekut, A. (2021). Survey nonresponse in attitudes towards immigration in Europe. Journal of Ethnic and Migration Studies, 47, 1136–1161. a, b, c, d
Pleis, J. R., & Dahlhamer, J. M. (2003). Family income nonresponse in the National Health Interview Survey (NHIS): 1997–2000. Paper presented at the Proceedings of the 2003 Joint Statistical Meetings. →
Purdam, K., Sakshaug, J., Bourne, M., & Bayliss, D. (2020). Understanding ‘Don’t know’ answers to survey questions—an International comparative analysis using interview paradata. Innovation: The European Journal of Social Science Research. a, b
R Core Team (2018). R: A language and environment for statistical computing. https://www.rproject.org/ →
Reeskens, T., & Hooghe, M. (2008). Cross-cultural measurement equivalence of generalized trust. Evidence from the European Social Survey (2002 and 2004). Social Indicators Research, 85, 515–532. →
Riphahn, R. T., & Serfling, O. (2005). Item non-response on income and wealth questions. Empirical Economics, 30, 521–538. →
Rosseel, Y. (2012). lavaan: an R package for structural equation modeling. Journal of Statistical Software, 48(2), 1–36. →
Schneider, F., & Asllani, A. (2022). Taxation of the informal economy in the EU. European Union. →
Schräpler, J.-P. (2004). Respondent behavior in panel studies: a case study for income nonresponse by means of the German Socio-Economic Panel (SOEP). Sociological Methods & Research, 33, 118–156. a, b, c, d
Schräpler, J.-P. (2006). Explaining income nonresponse—a case study by means of the British Household Panel Study (BHPS). Quality & Quantity, 40, 1013–1036. a, b, c, d
Schwartz, S. H. (2007). Value orientations: measurement, antecedents and consequences across nations. In R. Jowell, C. Roberts, R. Fitzgerald & G. Eva (Eds.), Measuring attitudes cross-nationally: lessons from the European social survey. SAGE. →
Schwartz, S. H., Verkasalo, M., Antonovsky, A., & Sagiv, L. (1997). Value priorities and social desirability: much substance, some style. British Journal of Social Psychology, 36, 3–18. a, b
Shoemaker, P. J., Eichholz, M., & Skewes, E. A. (2002). Item nonresponse: distinguishing between don’t know and refuse. International Journal of Public Opinion Research, 14, 193–201. a, b, c
Sicinski, A. (1970). ‘Don’t know’ answers in cross-national surveys. Public Opinion Quarterly, 34, 126–129. a, b
Silber, H., & Johnson, T. P. (2020). Culture and response behavior: an overview of cultural mechanisms explaining survey error. In P. S. Brenner (Ed.), Understanding survey methodology: sociological theory and applications. Springer. a, b
Silber, H., Roßmann, J., Gummer, T., Zins, S., & Weyandt, K. W. (2021). The effects of question, respondent and interviewer characteristics on two types of item nonresponse. Journal of the Royal Statistical Society Series A, 184, 1052–1069. a, b, c, d
Skelton, V. C. (1963). Patterns behind ‘income refusals. Journal of Marketing, 27, 38–41. a, b
Snijders, T. A., & Bosker, R. J. (2011). Multilevel analysis: an introduction to basic and advanced multilevel modeling. SAGE. →
Tourangeau, R., & Yan, T. (2007). Sensitive questions in surveys. Psychological Bulletin, 133, 859–883. →
Tourangeau, R., Groves, R. M., & Redline, C. D. (2010). Sensitive topics and reluctant respondents: demonstrating a link between nonresponse bias and measurement error. Public Opinion Quarterly, 74, 413–432. a, b
Vaerenbergh, Y. V., & Thomas, T. D. (2013). Response styles in survey research: a literature review of antecedents, consequences, and remedies. International Journal of Public Opinion Research, 25, 195–217. →
Vercruyssen, A., Wuyts, C., & Loosveldt, G. (2017). The effect of sociodemographic (mis) match between interviewers and respondents on unit and item nonresponse in Belgium. Social Science Research, 67, 229–238. →
Warner, U., & Hoffmeyer-Zlotnik, J. H. (2006). Discussion of the income measure in the European social survey: a proposal of revised survey questions about the ‘total net household income. In J. Harkness (Ed.), International workshop on comparative survey design and implementation (CSDI) Vol. 12. GESIS-ZUMA. →
West, B. T., & Blom, A. G. (2017). Explaining interviewer effects: a research synthesis. Journal of Survey Statistics and Methodology, 5(2), 175–211. →
Wickham, H., & Miller, E. (2022). haven: Import and Export’ SPSS’, ’Stata’ and ’SAS’ Files. https://github.com/tidyverse/haven →
Wickham, H., Averick, M., Bryan, J., Chang, W., McGowan, L. D. A., François, R., Grolemund, G., Hayes, A., Henry, L., & Hester, J. (2019). Welcome to the Tidyverse. Journal of Open Source Software, 4(43), 1–6. →
Yan, T., & Curtin, R. (2010). The relation between unit nonresponse and item nonresponse: a response continuum perspective. International Journal of Public Opinion Research, 22, 535–551. a, b, c, d
Yan, T., Curtin, R., & Jans, M. (2010). Trends in income nonresponse over two decades. Journal of Official Statistics, 26, 145–164. →
Zahid, R. A., Țaran, A., & Simga-Mugan, F. C. (2018). Cultural values and financial reporting practices: contemporary tendencies in Eastern European countries. Eastern Journal of European Studies, 9(2), 89–109. →